Blog Posts Tagged with Site Features
A Big Change to Alerts / Scans...
You may notice today that you're seeing more alerts listed for a stock than before. That's because I've made a pretty significant change to some things behind the scenes. By sort of an accident of evolution (let's call it), there have always been two classes of alerts (scans / signals) on the site. Old timers will remember that they were listed separately. They used to be called "Individual Pattern Scans" and "Advanced Scans".
Read More ➞Introducing Routines: A Better Way to Bookmark / Save Scans
I've just released a new feature called "Routines". Routines will allow you to organize your scanning & stock research workflow. They are essentially to-do lists. These lists can contain saved scans, URLs or plain text notes.
Each item in a routine has a checkbox to indicate whether it's been completed. You can simply click the boxes to toggle them between completed and incomplete. Each trading day, in the morning, the system will reset all of your items to incomplete.
Here are some situations in which these routines may be helpful:
Read More ➞Site Updates from the Last Several Months
Here's are several changes I've made to the site over the last several months:
A New Dashboard Page
I've added a dashboard page, where you can get a quick overview of what your stocks have done. You can reach that page via the "My Stocks" menu. I'll be adding more sections to the dashboard in the coming weeks. Please let me know if you have ideas for things you'd like to see there.
Read More ➞New Scan Option: Filter Only *Your* Stocks
The other day somebody asked me if there was a way to run a scan and only see results from his watchlists. There was not, but after discussing it for a while I saw how it could be useful to those who like to trade from a specific set of stocks.
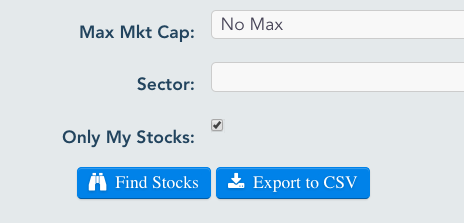
So I've now added the ability to run scans against just the stocks which are in your watchlists and portfolios. Just check the box next to "Only My Stocks" in the form where you enter your scan criteria.
Read More ➞New Addition: Stats on the Daily Scan Results
I recently added some data which may be helpful in getting a feel for what scans are "trending". I've started tracking the number of stocks which appear on each scan each day. That's enabled the ability to show how much above or below normal a scan is on any given day. You can find this data in two places.
Read More ➞Streamlined Adding of Stocks to Portfolios
I just made it a little easier to add stocks to portfolio lists in the app. Before you were required to enter the number of shares and the entry price. Those values are still required but they now get automatically set to default values (100 shares & the average price from the latest full trading day). So now you can just click the "Add to Portfolio" button without making any other adjustments.
This should come in handy for those who don't particularly want to track actual P&L within SwingTradeBot but, instead, want to track more stocks in order to get alerts/signals on them. This makes it easier to use a portfolio as an additional watchlist.
Read More ➞SwingTradeBot Expands to Seven More Global Stock Markets
Shortly after SwingTradeBot went live (with coverage of US listed stocks -- NYSE, Nasdaq & AMEX) a few years ago people started asking me if I could add coverage of various foreign (to me) markets. My answer was always "yes, I just need a data source for those markets". I also needed to make some changes to the "engine" to make it a bit more generic and to be capable of hadling other markets.
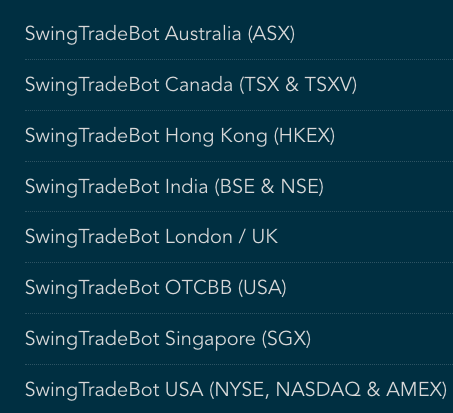
Well I've been tweaking things over the last few months and I'm happy to announce the launch of seven more sites covering the following markets:
Read More ➞Customizing Your Stock Screening

I'm sharing an email exchange I had earlier today in hopes that it will help others to find ways to get exactly what they want when using the site to scan for stocks. A friend sent me this:
I was looking through your hammer scans on SwingTradeBot to see how Zillow stacked up on the grading curve. I was surprised Zillow (Z) only got a B. I looked at the A rated puppies and felt like Zillow (Z) should be higher rated. Then I realized what I really want is a modified hammer scan. I want hammers that come at the end of a period of selling, even better if it is an oversold hammer or a hammer coming off a high. The preceding selling has to be at least three straight down days. Did you already read my mind and create such a thing, or do I need to put a suggestion in the idea box? :)
Here's my answer:
Read More ➞New Scans: MACD Crossovers!
Recently I've had several people ask me about MACD scans. Well I'm glad to announce that I've just added a few to alert/find MACD crossovers. They are:
Read More ➞Hover Charts Simplified
Update: /blog/you-can-now-view-scan-results-as-a-list-of-chartsNow there's an even faster way to view the charts.
I just made a change to the way the hover charts are launched. It is now easier to know where the charts are available and it should also be simpler to display them on Android devices. You'll now see a little chart icon next to stock ticker symbols in many of the tables around the site. Here's an example (If the image isn't animated, try clicking on it):

On a laptop or desktop computer you can simply hover your mouse pointer (cursor) over the chart icon and that stock's candlestick chart will appear. On mobile devices you can just tap the icon to reveal the chart. A second tap somewhere else on the screen will close the popped-up chart.
Read More ➞Reading Today's Technical Damage via the Scans Page and General Market Analysis Page
Back on February 8th I wrote about the negative divergence I noticed in one of my favorite indicators - the percent of stocks above their 50-day moving averages. If the market is having a healthy advance you should see a lot of stocks participating. That inidcator should be making higher highs along with the indices. The divergence in that indicator is a sign of a rally on poor breadth.
That divergence has been nagging at me since January but I've felt like I had to be a bull given the indices' stubborn advance. Well today it felt like the music stopped in a game of Musical Chairs and people were scrambling to sell. I thought last week's Fed decision to raise interest rates might have been the catalyst for a selloff but that didn't happen (and perhaps that was too obvious). Thankfully my nervousness had me keeping tight stops and I shorted some QQQ ahead of the Fed meeting. I was actually thinking about covering that short after this morning's gap up -- good thing I didn't!
I thought I'd follow up on that previous blog post by showing again how one can get a read on the market's health via some of the site's features. As I've mentioned, it's crucial to get a feel for the broad market's health & direction. I'm often asked which scan/signal is the best one -- but there's no one anser to that. Different things will work in different phases of the market. (I wrote a bit more on that topic in the FAQ) So I've put things on the site to help me do just that.
Read More ➞New Scan: Stocks Making a Cup-with-Handle Pattern
I'm releasing another new scan / signal today. This one finds stocks forming the handle portion of a cup-with-handle pattern. If you're not familiar with the cup & handle, here's a quick overview:
Read More ➞New Scans: Most Alerts, Most Bullish Alerts & Most Bearish Alerts
By popular demand, I'm releasing three new scans today They are:
Read More ➞A (Possibly) Disturbing Divergence on the General Market Overview Page
I've been noticing this while reviewing the Genreal Market Overview page for several days now and wanted to highlight it. I've written several times about how I use the "Percent of Stocks Above their 50-Day Moving Averages" (similar to Worden's T2108 indicator) as an overbought / oversold indicator. And I like it much better to signal oversold than overbought.
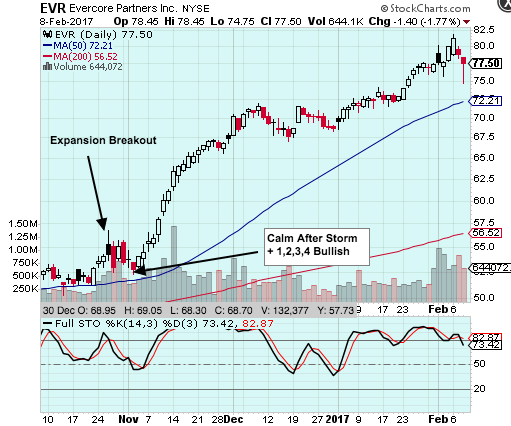
Read More ➞A Look Back at the Signals Which Launched EVR's 40+ Percent Rally...
The other day I was flipping through charts on the top percentage gainers scan and noticed the run EVR has had over the last three months. It's pretty much been straight up (more than 40%) since late October.
How To Save / Bookmark a Combination Scan
I was just asked this:
Would like to reduce the time for scan runs…..I have 4 different Combo scans which would be great to store and run daily. Is there a simple way save the scans and run without manual input?
Here's the answer:
Read More ➞The Super Duper Combo Scan is Here!
I just released a feature I've been wanting for a long time. I've also been asked for it by many people. It's essentially a scan of scans. You can now combine up to three scans into one result set. The stocks which will be returned are only those which match all the requested scans.
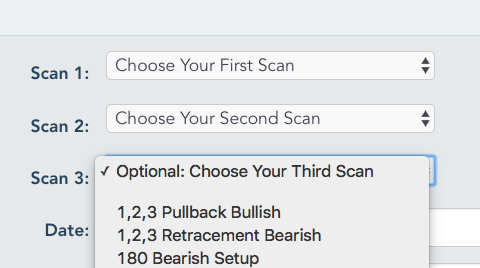
You'll find it on the main scans page called the 'combo scan'. This will make it even easier & faster to find trading candidates matching your trading style. Simply choose two or three different scans and enter the other criteia as usual.
Read More ➞New Scan: Trends in Multiple Timeframes
I just added another new scan thanks to Rick, who pointed out to me that this functionality was missing. As I told him, I guess I was too close to the forest to see the trees. I should have had this scan a long time ago, given that I've had the trend tables on the stocks since day one. So this scan allows you to find stocks based on what appears in the trend table on the individual stock pages. For example, BERY, which yesterday had this trend table:

- Long-Term Trend: Up
- Intermediate-Term Trend: Up
- Short-Term Trend: Down
New Feature: Sort the All Stocks Page... Plus Volatility
By popular demand, you can now sort the stocks in the "All Stocks" page! When I first created that page I never thought people would actually use it -- I really made it so that search engines could index the site easily. But, increasingly over time, people have been asking for the ability to sort the list of stocks, mainly because they wanted to sort by the letter grades.
Well I've enabled that plus sorting by other columns as well. You can simply click on the column header you wish to sort by. The first click will sort ascending and a subsequent click will reverse the sort.

Announcing Annual SwingTradeBot Plans!
I'm happy to announce the launch of annually-billed Pro plans! I've been asked about a yearly option several times and since I aim to please, here they are.

By opting for a yearly plan you can save up to 30% vs monthly billing. Annual pricing is the equivalent of:
- Gold Plan: 2 months free
- Platinum Plan: 3.5 months free
You can select annual billing on the Pricing Page. Just click the appropriate button which has the text "Annual Billing".
For those of you who are already on a monthly Pro (paid) plan if you switch over any remaining credit on your current plan will be applied to the annual plan's price. So, for example, if you are on the Gold Plan ($10/month) and switch halfway through your month, $5 will be credited toward the annual plan and you'll only be charged $94 to switch instead of $99.
As always, I'm happy to answer any questions. And now it's easier than ever to contact me. You can just hit me up via the little chat bubble in the bottom of every page on the site.
Read More ➞Recent Comments
- TraderMike on BOOT
- Dr_Duru on BOOT
- TraderMike on Stochastic Reached Oversold
- SuccessfulGrasshopper897 on Stochastic Reached Oversold
- Cos3 on Adding float as advanced filter criteria?
From the Blog
Blog Tags
Featured Articles