New Addition: Stats on the Daily Scan Results
August 08, 2017
I recently added some data which may be helpful in getting a feel for what scans are "trending". I've started tracking the number of stocks which appear on each scan each day. That's enabled the ability to show how much above or below normal a scan is on any given day. You can find this data in two places.
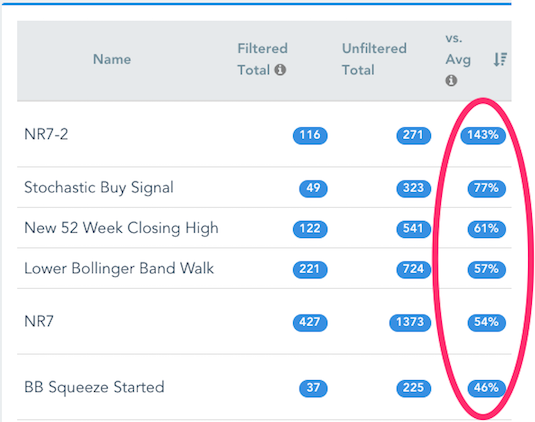
The first place to find this data is on the All Scans Page in the "vs. Avg" column. You can sort the table by that column in order to see which stocks are "hot" or "cold" for that day. So the screenshot below shows that there was an above normal amount of range contraction (NR7, NR7-2 and Bollinger Band Squeezes starting), some oversold stocks perking up (Stochastic Buy Signals), a lot of new 52-week closing highs and an abnormal number of stocks walking down their Lower Bollinger Bands (probably reactions to disappointing earnings) for that day.
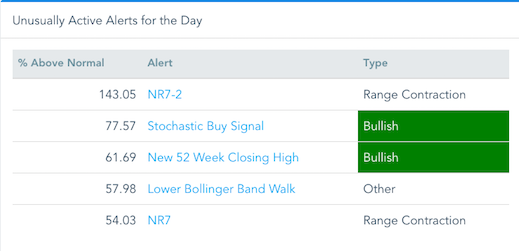
A subset of that data is also available on the General Market Overview / Recap page. The five scans with the highest percentage change above normal are listed there.
This data should be helpful to get a quick feel for what's going on under the market's surface and, more important, some guidance on where to look for trading opportunities on any given day.
scans site features screens
Comments
SwingTradeBot about 7 years ago
Hi Harry. I'm glad the site is helping you to make some money! You've chosen two of my favorite bullish scans to combine. I don't know of a way to make them more potent. They're not all going to work! It's just a game of probabilities. I tend to like charts that show a bit of a pullback (2 - 4 average true ranges down from the recent high). Those tend to be rated B or C so maybe focusing on those stocks may help. But, again, it's just a game of probabilities and there's no guarantee that any one setup is going to work (or fail).
SwingTradeBot about 7 years ago
Hi Mike..I am from India and I must say that your site is amazing. By following the scans in your site I have got the profitable trades. Thank you very much for creating a site like this for including India.I have a question : when I use the combo scan " Non ADX 1-2-3-4 bullish" as scan 1 and "Calm after storm" as scan 2 which gives a good bullish swing set up. However I see that some stocks which come up in the scan do not take part in the rally or upside. Any thoughts on how I can make the setup more potent ? Thanks a lot for your inputs.
View full discussion...
Popular Now
Recent Comments
- TraderMike on BOOT
- Dr_Duru on BOOT
- TraderMike on Stochastic Reached Oversold
- SuccessfulGrasshopper897 on Stochastic Reached Oversold
- Cos3 on Adding float as advanced filter criteria?
From the Blog
Blog Tags
Featured Articles