Reading Today's Technical Damage via the Scans Page and General Market Analysis Page
March 21, 2017
Back on February 8th I wrote about the negative divergence I noticed in one of my favorite indicators - the percent of stocks above their 50-day moving averages. If the market is having a healthy advance you should see a lot of stocks participating. That inidcator should be making higher highs along with the indices. The divergence in that indicator is a sign of a rally on poor breadth.
That divergence has been nagging at me since January but I've felt like I had to be a bull given the indices' stubborn advance. Well today it felt like the music stopped in a game of Musical Chairs and people were scrambling to sell. I thought last week's Fed decision to raise interest rates might have been the catalyst for a selloff but that didn't happen (and perhaps that was too obvious). Thankfully my nervousness had me keeping tight stops and I shorted some QQQ ahead of the Fed meeting. I was actually thinking about covering that short after this morning's gap up -- good thing I didn't!
I thought I'd follow up on that previous blog post by showing again how one can get a read on the market's health via some of the site's features. As I've mentioned, it's crucial to get a feel for the broad market's health & direction. I'm often asked which scan/signal is the best one -- but there's no one anser to that. Different things will work in different phases of the market. (I wrote a bit more on that topic in the FAQ) So I've put things on the site to help me do just that.
Frist, another look at the percent of stocks above their 50-day moving averages (from the General Market Analysis - Daily Recap page):
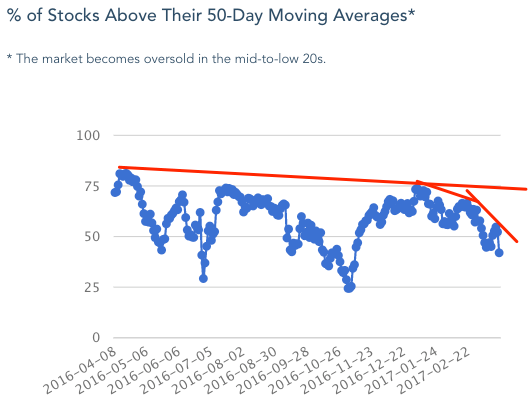
You can hover your mouse over points on the chart (not the image above but the actual chart on the General Market page) to see each day's value. The indicator dropped from 52% to 42% today! The Nasdaq was just a hair from a new high yesterday and the S&P 500 wasn't far behind. So it's kinda shocking for only 52% of stocks to be above their 50-day moving averages. The thing that's tough about this, which I said in February, is you never know how things are going to play out -- will the strong stocks pull up the weaker ones or vice versa? In this case it was mostly smaller cap stocks that were lagging. It feels to me like there was just money being poured into large cap mutual funds and/or ETFs and those underlying stocks were pretty much being bid up indiscriminately.
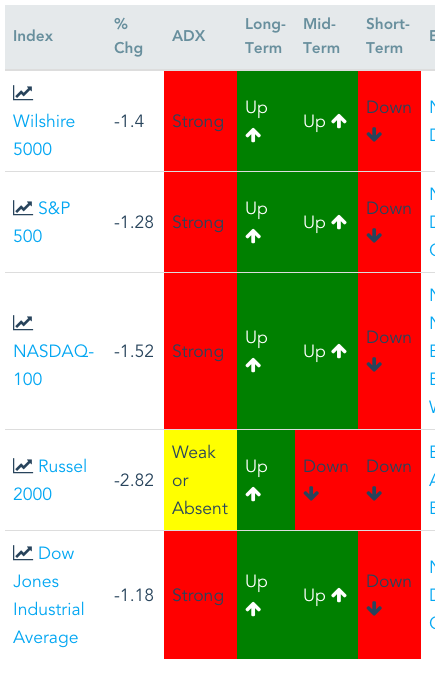
Today's selling did a good amount of technical damage to the market. One place to see that is the Trend Table for the Indices (on the general Market Analysis page)
The trend table went from this yesterday -- lots of happy green:

to this today:
(You can switch can look at other day's recaps via the Previous & Next Buttons at the bottom of the page)

Looking at the index ETF charts you'll see that QQQ closed at a 22-day low and the S&P 500 at a 24 day low. So it's no surprise to see the short term trends flip to red today. The bulls shouldn't feel too bad though, since the longer term trends are still intact (aside from the Russell 2000).
The other indicators (Advance/Decline, Bullish Alerts/Bearish Alerts, New Highs/New Lows) on that page can give you a feel for today's action. I've been considering plotting those indicators over time in order to more easily see confirmation or divergences in those as well. I'll probably make that change in the next couple of weeks.
The "Top Alerts" section also helps to give a feel for the day's action:
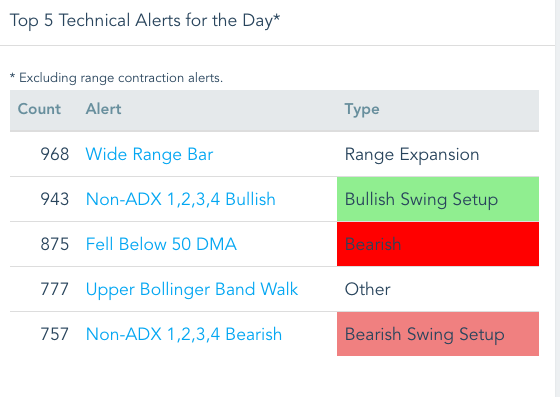
At first glance that may not look so bad but the #1 alert for the day -- wide range bars -- is actually bearish today given that many of those bars/candlesticks opened near their highs and closed near their lows. The 875 stocks breaking their 50-day moving averages accounts for the above-mentioned indicator sliding 10 percentage points today. And finally, if you're looking for short selling setups, that 5th alert/scan may be a good place to check.
You can get a similar feel for today's action on the 'All Scans' page. You can sort that list by the number of stocks making each scan. The other piece of info on that page is a graph of the bearish alerts (aka signals or scans) vs. the bearish ones.

Today it shows that of all the bullish & bearish alerts combined 76% were bearish. I use that as a guide on which side (bull or bear) I want to focus on for the next day. So in this case I'll mainly be looking for good shorting setups for tomorrow.
However, I'm not in all-out bearish mode. I'll also be checking some scans to add some buy candidates to my watchlists. It will be interesting to see what pops up on the following scans:
- 1,2,3 Pullback Bullish & Non-ADX 1,2,3,4 Bullish - I check one or both daily
- 50 DMA Support
- Strong but Oversold - leading stocks which have gotten dragged down along with the market.
- Stochastic Reached Oversold - for the B & C rated stocks
- STB 50 Bullish - another one I've started using every day. I find it useful to look back a day or two as well.
site features general market overview
Comments
SwingTradeBot over 7 years ago
Excellent Post....!!!!!!!!!!! Great Info on using the information on your site effectively. I also think it would be a great idea to see the Advance/Decline, Bullish Alerts/Bearish Alerts, New Highs/New Lows plotted the way they currently are AND over time as well. Them along with the % of Stocks Above Their 50-Day Moving Averages are great market sentiment indicators. Keep up the great work Mike...!!
SwingTradeBot over 7 years ago
It's been a long time since the trees were shaken. Whole branches my splinter!
SwingTradeBot over 7 years ago
Yeah, it wouldn't surprise me at all for T2108 to drop below 20 in the near future. It's seems it's time to shake the trees again
SwingTradeBot over 7 years ago
Great stuff, of course. I have a similar take on the day, but my conclusion is more outright bearish...in the short-term at least! I think the market could hit oversold readings with very little additional selling. Maybe just another 2 or 3 days....
View full discussion...
Popular Now
Recent Comments
- TraderMike on BOOT
- Dr_Duru on BOOT
- TraderMike on Stochastic Reached Oversold
- SuccessfulGrasshopper897 on Stochastic Reached Oversold
- Cos3 on Adding float as advanced filter criteria?
From the Blog
Blog Tags
Featured Articles