A Look Back at the Signals Which Launched EVR's 40+ Percent Rally...
February 08, 2017
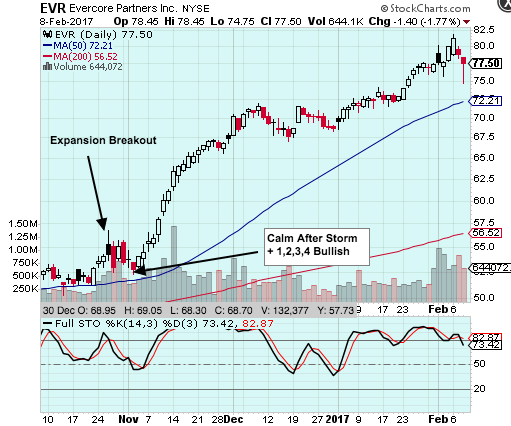
The other day I was flipping through charts on the top percentage gainers scan and noticed the run EVR has had over the last three months. It's pretty much been straight up (more than 40%) since late October.
I like to study charts like that to see how I could have gotten on board for the rally. Key questions for me are:
- What signal(s) did SwingTradeBot give when the move began?
- If there were no signals, can I create one to catch a similar move int he future?
- If there were signals, why/how did I not take advantage of them?
I want to share my study process for doing that kind of research as well as show how you can use the signals to get help catch moves like this. I'm often asked which signals are the best and my answer is always "it depends". Part of what it depends on is what type of trader you are. So doing this type of research can help you to find what signals you're comfortable with.
I'll start by examining the action around the beginning of EVR's move.
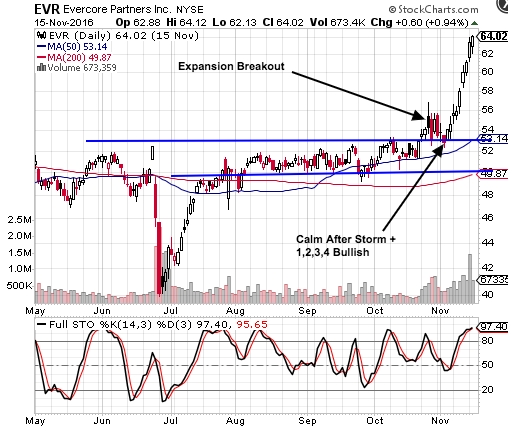
As you can see, the stock broke out of a sideways consolidation in late October -- the 26th to be exact. Volume was 2 times normal. So let's look at the alerts the site produced that day. You can examine the history of a stock's signals by clicking the "Older Signals" button on the stock's main page:
Here's are EVR's alerts from late October:
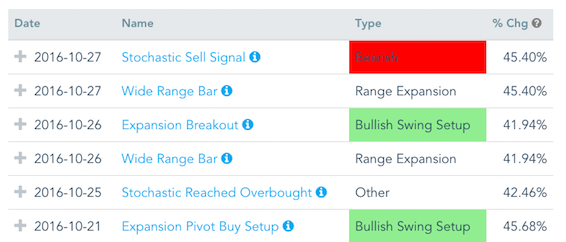
So it triggered an Expansion Breakout (EB) signal and made a Wide Range Bar (which is a little redundant, given that the Expansion Breakout has to have a wide range) What stands out to me is the combo of an expansion breakout, high volume and breaking out from a long sideways consolidation. I check the Expansion Breakout scan almost every day, so I see a good number of Expansion Breakouts but not so many from a tight, sideways consolidation.
One thing to note here is the trading rules for an EB -- note that you should buy ABOVE the high of the EB day. So if you're comfortable with that (I tend to prefer pullbacks), you could have entered an order (see my post about order types). It would not have triggered the next day, so no harm, no foul.
So if you still like the stock, you could add it to a watchlist in order to be updated about it as it triggers more setups.
The next day it actually triggered a Stochastic Sell Signal. That signal brought the stock back to the top of the trading range it broke out of the other day. So I would not put a lot of weight on that sell signal for a few reasons:
1. It's still (barely) in breakout range & the top of the old trading range should now flip from old resistance to new support
2. Even if the signal were confirmed by a more lower, I think it's likely that it would just go back to being range-bound.
3. All its trends (short, intermediate & long-term) were UP. I'll heed to the prevailing trend(s).
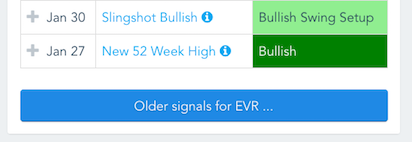
It also made a Slingshot Bullish on the same day as the Stochastic Sell Signal -- so mixed signals might be another reason to do nothing based on the signals on the 27th. If you had entered an order based on the bullish signal, and you followed its rules, that order would not have triggered because on the 28th it didn't trade 10 cents above the high on the 27th
So over the next few days there were some range contraction alerts, which should be taken as a bullish sign -- they show that the stock is consolidating its gains while managing to stay in breakout territory.
But things get interesting on November 2nd. We get a combo of two of my favorite signals: Non-ADX 1,2,3,4 Bullish and Calm After Storm. Based on the Non-ADX 1,2,3,4 rules you could have entered an order to buy 10 cents above the Nov. 2nd high. You would have been filled on the next day around $54. The stock was off to the races since then. It's up around 45% since that entry point. The site hasn't issued a single bearish signal on EVR since then.
So my take-aways from this are:
- I need to pay more attention to the EBs from long consolidations -- I've created a special watchlist for recent EBs of that type.
- Use the combo scan to find Non-ADX 1,2,3,4 Bullish Pullbacks combined with Calm After Storms
Of course not every signal is going to work out this well. But the idea is to catch enough trades like this to pay for some small losers which will inevitably be in the mix. But, again, I wanted to show a process of researching which signals might work well for your trading style.
scans watchlists site features screens Range Expansion order entry Breakout signals combo scan
Comments
SwingTradeBot over 7 years ago
Great Post. Thanks...!!!
SwingTradeBot almost 8 years ago
Nice post
View full discussion...
Popular Now
Recent Comments
- TraderMike on BOOT
- Dr_Duru on BOOT
- TraderMike on Stochastic Reached Oversold
- SuccessfulGrasshopper897 on Stochastic Reached Oversold
- Cos3 on Adding float as advanced filter criteria?
From the Blog
Blog Tags
Featured Articles