Blog Posts Tagged with Trading
Trades of the Week: Feb 12 - Feb 16, 2024
SMCI saved what was a pretty frustrating week which was full of near misses and whiffed trades.
Read More ➞Trades of the Last Couple of Weeks: Jan 22 - Feb 9, 2024
This was my first full week of trading after returning home from my Australia trip. I'm going to do this post a little differently than the previous few just to shake things up a bit.
Read More ➞Trades of the Week: Jan 15 - Jan 19, 2024
My first week of vacation in Australia has been great for my trading account. Maybe I should stay on vacation. Hmm...
I carried AMD & TEAM over the weekend.
Trades of the Week: Jan 8 - Jan 12, 2024
I came into this week short WGMI and long QS, TEAM, AMD, DYN and TANK. Those essentially used up all my non-margin buying power. As I mentioned in a position sizing discussion on the Canadian version of SwingTradeBot, I don't like to be on margin overnight. But after initiating a few of more trades early in the week I soon found myself needing to lighten up -- late Tuesday my brokerage pinged me that I had exceeded my overnight buying power (a Regulation T violation). So I had to choose some stocks to sell or the brokerage would have done it for me.
Read More ➞Trades of the Week: Jan 2 - Jan 5, 2024
I'm going to take another crack at consistently making these posts. However, there may not be any posts during the last 2 weeks of January because I'll be on vacation in Australia & not sure if I'll make any trades.
As before: My goal here is to show a bit of my process and the scans I use to find these trading candidates. They certainly won't be the best trades one could have possibly made, it will just highlight those I found and chose to take
Lessons from My 2023 Trading Results
I want to share what I’ve learned from my 2023 trading but first I’d want to zoom out to a longer term view. Here’s a chart of my trading account’s returns since I moved to Interactive Brokers in 2015:
Read More ➞How SwingTradeBot Helped Me Have a Great Trading Week
I had a couple of really nice trades this week that I want to discuss. I half-jokingly tweeted about the first one, chalking it up to dumb luck. While there was certainly some luck involved, I'm reminded of that old saying about luck:
Read More ➞Trades of the Week: Jan 29 - Feb 2, 2018
So this was quite an interesting week. It started out as death by a thousand cuts for me. Well, it wasn't quite that bad, just a little choppy. But Friday was my best day of 2018 thanks to my willingness to go short.
Read More ➞Trades of the Week(s): Jan 15 - 26, 2018
So this was a slow couple of weeks for me. I was out of the country on vacation for most of that period, so I was trying not to do much trading. Also, I don't like to do a whole lot in the heart of earnings season, because the market can often become choppy from one day to the next based on how the reports are each day.
First an update on the positions (CENX & MNTA) I mentioned in the previous Trades of the Week.
Read More ➞Trades of the Week: Jan 8 - 12, 2018
I'm going to try to do a post like this at least every other week. My goal here is to show a bit of my process and the scans I use to find these trading candidates. They certainly won't be the best trades one could have possibly made, it will just highlight those I found and chose to take.
CENX
First up is CENX. This stock has been on my watchlist for a few weeks because I traded it in December. I bought above that consolidation pattern at $16.14 (with a stop loss under that rectangle at 15.30 -- a great example of a classic Darvis Box or a flag) and sold it on December 28th at 19.82. So my initial risk (1R) (read more about R and R multiples here) was 84 cents per share, so I made 4.4 times my initial risk (4R). I liked how the stock was acting, so I kept an eye on it by adding it to one of my watchlists.
Read More ➞How This Trader Made $220,000 (37% gain) in October 2017...
Here's a great blog post by @SmashTheBid detailing his trading last month. It does a great job of illustrating some things I've been harping on for well over a decade. Namely:
- You don't need a high win-rate to make money. He made that $220K with a 62% win rate. The key is to keep your winners bigger than your losers and to have a positive expectancy
- You can make money on non-penny stocks! He made significant amounts of money on stocks priced over $20 and those priced under $20. And many people wouldn't even consider trading stocks above $5 or $10! (It drives me crazy to see people focus so much on low-priced stocks. You should think in amounts of money invested and percentages, not number of shares and points!)
- There's a lot of opportunity on the short side. 40ish % of his profit came from shorting.
- It's important to keep and review a trading journal.
- It's critical to have a plan and stick to it.
Check Out: Chart Summit, a Virtual Conference on Technical Analysis
I'm looking forward to watching some of the presentations over at Chart Summit, a virtual conference of technical analysis. I've been a fan of Brian Shannon's for over a decade and I met Chris Kimble at Stocktoberfest a couple of years ago after watching his impressive talk. So I already know their talks will be great. Judging by some of the talk titles, those videos should be helpful to folks new to technical analysis in figuring out ways to use SwingTradeBot's scans & signals.
Here's the email I got announcing the availability of the Chart Summit videos:
Read More ➞Lessons Learned From My 2016 YTD Trading Results
I thought I'd share some thoughts I had while reviewing my trading results so far this year. Through today, the end of September 2016, the Nasdaq is up 6.08%, and the S&P is up 7.09% while my swing trading account is up 33.09%. While I'm happy to be outpacing the market by 4.5x, I'm a little disappointed that my account isn't up even more. That's because I know I missed a few trades that could have easily doubled or tripled my gains from where they are now. Nonetheless, I feel good that I've mostly stuck to my rules and that I'm still trading with a positive expectancy. Let's take a more detailed look.
Equity Curve
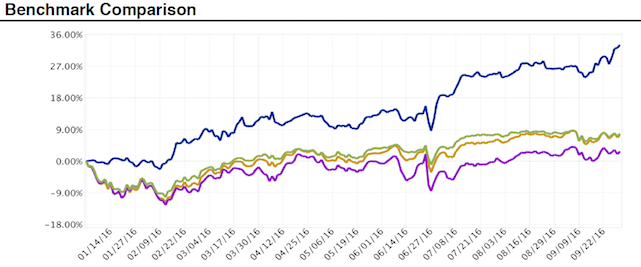
The dark blue line in chart above is my account and the green line is the S&P 500. What stands out to me when viewing my equity curve is that it's been a pretty orderly rise punctuated by some choppy, sideways action -- and then there was Brexit on June 27th. The primary reason for the sideways periods is that the market itself was chopping around and I try to do less when the market is not trending up or down.
Read More ➞Popular Now
Recent Comments
- TraderMike on BOOT
- Dr_Duru on BOOT
- TraderMike on Stochastic Reached Oversold
- SuccessfulGrasshopper897 on Stochastic Reached Oversold
- Cos3 on Adding float as advanced filter criteria?
From the Blog
Blog Tags
Featured Articles