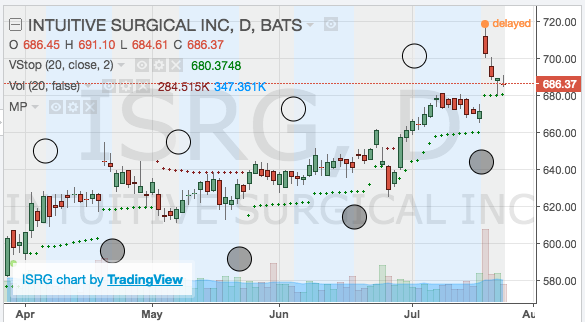
Blog Posts Tagged with Charts
Custom Chart Indicator Settings
Pro users can now customize the appearance of the stock charts on the indivudual stock pages. So if you'd like to see the phases of the moon on your chart instead of the default Bollinger Bands, here's how you change the settings.
Navigate to the 'Account' menu and choose the 'Chart Indicator Settings' sub-menu. That will take you to a page where you can select from the following idicators:
Read More ➞New Feature: Hover Charts for Even Quicker Stock Screen Analysis
Update: Now there's an even faster way to view the charts.
I've just implemented a feature I've wanted since I launched the site. You can now hover your cursor (mouse pointer) over a stock ticker to get a pop up of the chart. (Similar to how FinViz.com pop-up charts work.) Here's an example:

For now this works on all of the stock scan result pages as well as your portfolio and watchlist pages (and one of my favorite pages, the list of recent IPOs). My primary goal with this site is to make my nightly analysis process more efficient and this has already boosted my productivity a lot.
Read More ➞Recent Comments
- TraderMike on BOOT
- Dr_Duru on BOOT
- TraderMike on Stochastic Reached Oversold
- SuccessfulGrasshopper897 on Stochastic Reached Oversold
- Cos3 on Adding float as advanced filter criteria?
From the Blog
Blog Tags
Featured Articles