Blog Posts Tagged with Watchlists
Managing Your Watchlists
Duru has posted another video, this time showing how he cleans up (manages) his SwingTradeBot Watchlists.
Read More ➞Video: Technical Analysis with SwingTradeBot
Over the weekend my good friend Duru posted a video (on his "Dr. Duru Diagnoses Markets" YouTube channel) of his stock screening process using SwingTradeBot. I think it will be helpful to those new to the site and/or new to technical analysis.
Exporting Scan Results to a TradingView Watchlist
I was asked earlier today about how to export a list of stocks from a SwingTradeBot scan result into a TradingView Watchlist. That reminded me that I forgot to write about an enhancement that I added last summer.
In response to another TradingView watchlist request I added another column (called tradingview_symbol) to SwingTradeBot's CSV file exports. That column contains TradingView's ticker symbol. TradingView combines the stock symbol with the stock's listing exchange, so AAPL, which is listed on the Nasdaq would be NASDAQ:AAPL. So that column of data will look something like:
Read More ➞New Scan Option: Filter Only *Your* Stocks
The other day somebody asked me if there was a way to run a scan and only see results from his watchlists. There was not, but after discussing it for a while I saw how it could be useful to those who like to trade from a specific set of stocks.
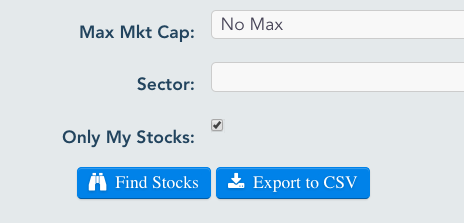
So I've now added the ability to run scans against just the stocks which are in your watchlists and portfolios. Just check the box next to "Only My Stocks" in the form where you enter your scan criteria.
Read More ➞Streamlined Adding of Stocks to Portfolios
I just made it a little easier to add stocks to portfolio lists in the app. Before you were required to enter the number of shares and the entry price. Those values are still required but they now get automatically set to default values (100 shares & the average price from the latest full trading day). So now you can just click the "Add to Portfolio" button without making any other adjustments.
This should come in handy for those who don't particularly want to track actual P&L within SwingTradeBot but, instead, want to track more stocks in order to get alerts/signals on them. This makes it easier to use a portfolio as an additional watchlist.
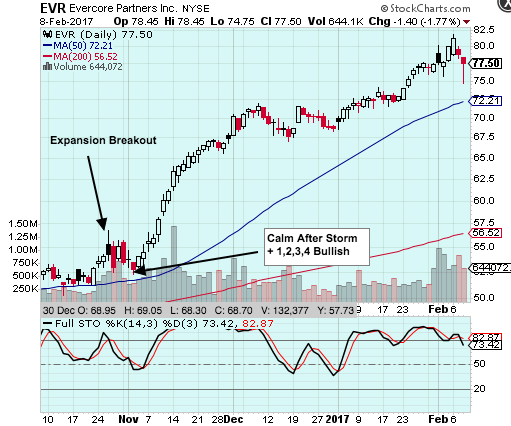
Read More ➞A Look Back at the Signals Which Launched EVR's 40+ Percent Rally...
The other day I was flipping through charts on the top percentage gainers scan and noticed the run EVR has had over the last three months. It's pretty much been straight up (more than 40%) since late October.
Removing Stocks from Your Watchlist or Portfolio
I just received an email asking me how to remove stocks from a watchlist. It's pretty straight-forward but it may not be obvious if you're using a mobile device. If you're using a desktop or laptop computer (or maybe even a large tablet) you'll see a trash can icon over on the right side of each stock's row. Just click the trash can icon to remove the stock from the list -- note that the table scrolls horizontally & you may have to scroll it to see the trash can icon. The pencil icons allow you to edit the stock's details (The note for a watchlist... stop loss values, number of shares, entry price, etc. for a portfolio).

If you are on a mobile device it a little trickier. For most of the tables on the site, columns get hidden to conserve space on mobile devices. You'll be able to tell when data/columns have been hidden because you'll see a plus sign on the left side of each row. Tapping the plus sign or just tapping anywhere in the row will expand the row and show the hidden columns. Once the row has been expanded you can click the "+" to reveal the trash can. See below:

Finding and Tracking IPOs to Trade
I've been involved in the market for just over 20 years now and some of my best trades have always been in stocks which IPO'd not long before I bought them. That's because those companies (at least the good ones!) are usually very innovative, are (should be) growing quickly, have small floats and once they break to new highs there's no 'natural' overhead supply of sellers. So one of the things I wanted SwingTradeBot to help me with was tracking IPOs. I generally like to jump into IPOs in two different ways:
- as they break out to a new high
- as they pull back and reverse after a big pop on their IPO day
Investors Business Daily (IBD) / CANSLIM is also a big fan of IPOs. Here's a small sampling of what they've written about IPOs: From IPOs Can Be Risky But Profitable
Read More ➞New Features and Pro Plans
You may have noticed some changes to the site this week. The other day I added three tiers of subscription plans. They are:
- Free Plan - limited set of features
- Gold Plan @ $10/month - Pro set of features
- Platinum Plan @ $17.50/month - Pro set of features+
I've converted all pre-existing users to the Free Plan. Previously users could add an unlimited number of stocks to their watchlist and portfolio. Now the free plan limits you to 5 stocks on your watchlist and 5 stocks on your portfolio. Note that if you had more than 5 stocks on your lists you will still have those stocks in your lists. However, you won't be able to add new stocks to those lists until the list contains fewer than 5 stocks.
The Pro plans provide:
Read More ➞New Feature: Hover Charts for Even Quicker Stock Screen Analysis
Update: Now there's an even faster way to view the charts.
I've just implemented a feature I've wanted since I launched the site. You can now hover your cursor (mouse pointer) over a stock ticker to get a pop up of the chart. (Similar to how FinViz.com pop-up charts work.) Here's an example:

For now this works on all of the stock scan result pages as well as your portfolio and watchlist pages (and one of my favorite pages, the list of recent IPOs). My primary goal with this site is to make my nightly analysis process more efficient and this has already boosted my productivity a lot.
Read More ➞How I Use SwingTradeBot
I created this site to help me manage and speed up my nightly stock research. Here I'll share how I'm currently using the site as a way to help others see how everything here ties together. My process consists of a few general categories:
- Analyzing the broad market
- Finding new trading candidates
- Managing positions that I currently hold
- Managing / monitoring my watchlist
The Power of Our Watchlist Features
Today I spent the day out of town at Stocktoberfest. Despite being at a stock market conference, I was really disconnected from the markets... I checked in on my portfolio once during the day and that was it. After dinner I was discussing SwingTradeBot with another trader and website founder. He told me that he had visited SwingTradeBot but that he hadn't signed up b/c he didn't see a reason to because so much of the site is open to unregistered visitors. I told him that he was missing out on what I consider to be the most important features of the site: the watchlists and portfolios. Here's why...
Read More ➞New Scans: Strong, Oversold Stocks and Weak, Overbought Stocks
I added a few new scans to the site last night. They are:
- Strong stocks which are in oversold territory.
- Stong stocks which are in oversold territory AND made a bullish reversal pattern for the day being scanned.
- Weak stocks which are in overbought territory.
- Weak stocks which are in overbought territory AND made a bearish reversal pattern for the day being scanned.
Some definitions:
Read More ➞Popular Now
Recent Comments
- TraderMike on BOOT
- Dr_Duru on BOOT
- TraderMike on Stochastic Reached Oversold
- SuccessfulGrasshopper897 on Stochastic Reached Oversold
- Cos3 on Adding float as advanced filter criteria?
From the Blog
Blog Tags
Featured Articles