Blog Posts Tagged with Volatility
Introducing the 'Calm After the Storm' Stock Scan
A few days ago I added a new scan which I'd been thinking about for a while. This scan was motivated by a somewhat tedious process I do almost daily during earnings season. I like to find stocks which have had a strong positive initial post-earnings response and then sell off a bit before rebounding. In order find those stocks I would look at the Earnings Movers scan for each of the previous 5 days or so. I would quickly look at those charts (using the hover charts feature) and then more closely inspect any stocks that were setting up to my liking.
The recent action in Shopify (SHOP) is a great example of the type of action I'm trying to find. I happened to catch SHOP setting up intraday on February 19th and I bought some when I saw it rebounding from the lows of the day. Here's the chart:
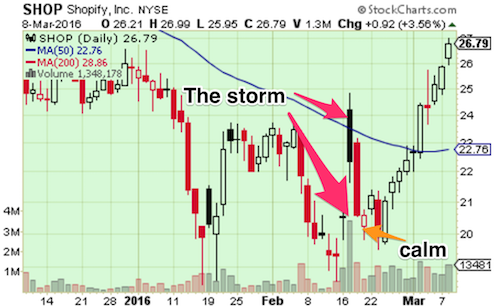
As you can see SHOP gapped up after earnings on the 17th and sold off the rest of the day (a gap & trap). It continued to sell off the next day and closed the gap from the previous day. (Closing the gap isn't a requirement but in this case I took it as a plus.) The action on the 19th (an open narrow-range candlestick after two long/tall dark/closed candlesticks) gave me confidence that the selling was over and that SHOP *might* try to mount a rebound back to the post-earnings high. This is a classic case of volatility swinging from high to low and (hopefully) back to high again. Obviously that trade worked out quite well -- I'm still holding SHOP today with approximately 30% gain.
I see this type of setup a lot but often not until after the rebound move is already underway. So I wanted to create a scan which would unearth these setups for me. That scan is what I'm calling the "Calm After Storm". Here's what it finds:
Read More ➞Trading the VIX using Bollinger Bands
Back in October, while at Stocktoberfest, I attended a talk by Chris Kimble of Kimble Charting Solutions titled "How to Capitalize on the Technimentals" It was about "how investors can benefit from combining the power of the pattern along with sentiment and fundamentals." As part of that discussion Chris covered a trade he had recently initiated. He got long XIV, the inverse VIX ETN during the mid-October selloff. (He now has a follow-up blog post showing how the trade played out -- looks like he made about a %40 profit in less than 4 weeks). I was really impressed with that strategy, which was basically a bet that volatility would return to its recent norm (mean reversion).
Since then I've been watching the VIX and XIV closely, waiting for a chance to put on a similar trade. As you know, volatility has been spiking of late largely thanks to the slide in the price of oil. So I've been studying the charts of the volatility instruments this week and I noticed something really interesting -- it seems that there are pretty good signals to not only short volatility but also to get long it. If you've spent any time at all on this site you'll notice a lot of mentions of Bollinger Bands and NR7 bars / candles. I use both of those to capitalize on the fact that low volatility begets high volatility (and high begets low). In other words, I'm always on the lookout for prices to swing from periods of range contraction to range expansion.
Read More ➞Recent Comments
- TraderMike on BOOT
- Dr_Duru on BOOT
- TraderMike on Stochastic Reached Oversold
- SuccessfulGrasshopper897 on Stochastic Reached Oversold
- Cos3 on Adding float as advanced filter criteria?
From the Blog
Blog Tags
Featured Articles