Blog Posts Tagged with Scans
Video: Technical Analysis with SwingTradeBot
Over the weekend my good friend Duru posted a video (on his "Dr. Duru Diagnoses Markets" YouTube channel) of his stock screening process using SwingTradeBot. I think it will be helpful to those new to the site and/or new to technical analysis.
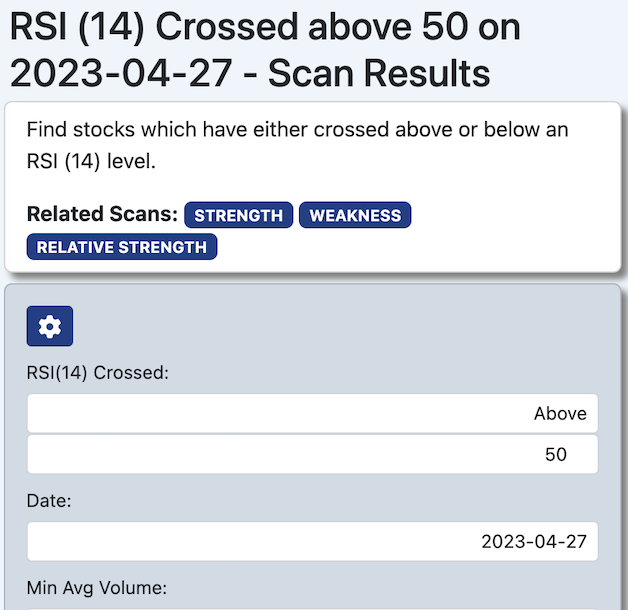
New Scan: RSI Crossover
That scan is located in the "Relative Strength" scans category which can be reached via the Research menu -> End of Day Scans -> Scans By Type
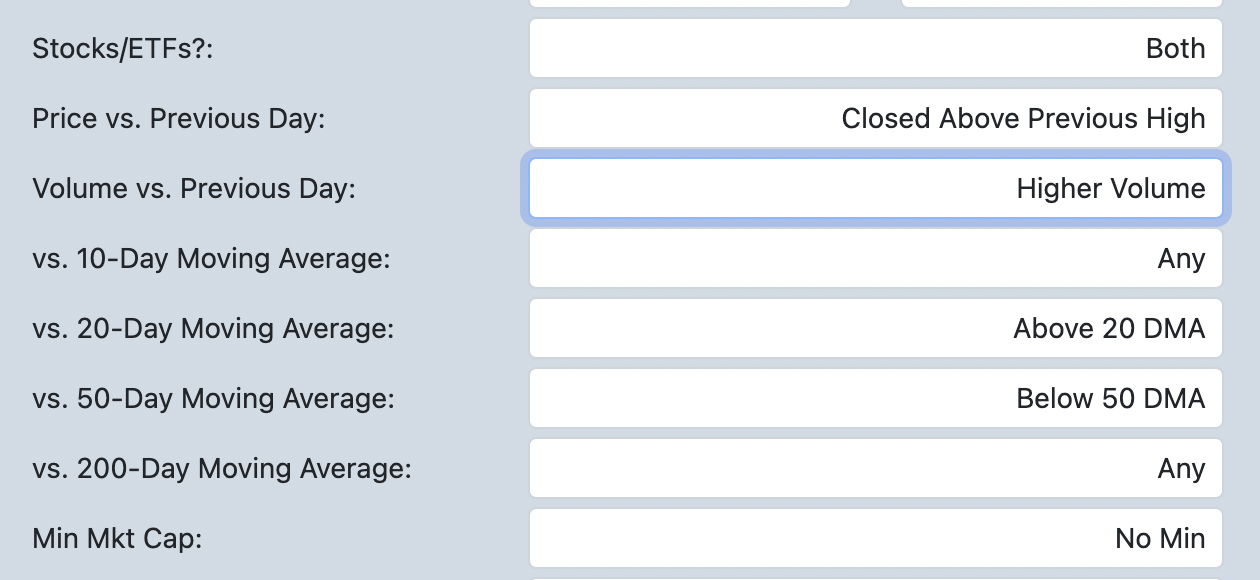
Several New Scan Filters
- Closing Price vs. Previous Day's High or Low
- Volume vs. Previous Day (greater than or less than)
- Closing Price vs. 10-Day Moving Average (above or below)
- Closing Price vs. 20-Day Moving Average (above or below)
- Closing Price vs. 50-Day Moving Average (above or below)
- Closing Price vs. 200-Day Moving Average (above or below)
Scanning for Back-to-Back Signals
A few weeks ago I added a new type of scan which I've called "Back-to-Back". It enables you to find stocks which have made certain signals on up to 3 consecutive days. For example, you can scan for stocks which fell below their 50-day moving average on one day and climbed back above the 50 DMA on the next day.
Read More ➞Year-End: Perfect Time to Evaluate your Process
There's a video by David Keller, which I linked in the featured links section, titled: "Re-Evaluating Your Process". It really resonated with me that 3 of his questions were about routines. I certainly recognize the importance of having good routines and sticking to them, which is why I created the routines section of SwingTradeBot. (Here's my original blog post about the routines functionality.)
Read More ➞Exporting Scan Results to a TradingView Watchlist
I was asked earlier today about how to export a list of stocks from a SwingTradeBot scan result into a TradingView Watchlist. That reminded me that I forgot to write about an enhancement that I added last summer.
In response to another TradingView watchlist request I added another column (called tradingview_symbol) to SwingTradeBot's CSV file exports. That column contains TradingView's ticker symbol. TradingView combines the stock symbol with the stock's listing exchange, so AAPL, which is listed on the Nasdaq would be NASDAQ:AAPL. So that column of data will look something like:
Read More ➞Filter Scans by Stocks with Options & Weekly Options
For a few months now, you've been able to filter scan results by stocks with options (which are optionable). Earlier this week, by request, I also added the ability to filter by stocks which have weekly options. Here is where you can find those filters:
Read More ➞You Can Now View Scan Results as a List of Charts
I just released a new feature which will be a huge time saver when looking through scan results. There's a new option which allow you to see up to 20 charts at a time. It looks like this:
Read More ➞New Feature: Scan Within a Date Range
Scanning for a given pattern / signal over a range of dates is a feature I've wanted for a long time. A nice side-effect of the recent change I made to the way things are stored in the site's database is that it's now much easier for me to build that capability. Over the last couple of weeks I received a few requests for adding a date range to the scans. So starting today paid subscribers will be able to run scans across a date range. You'll see that there's now an end date as part of the search / filter criteria.
Read More ➞Backtesting Using (Google) Spreadsheets and SwingTradeBot
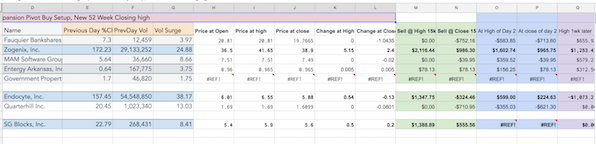
I had a really good email exchange with somebody (Jason) the other day. He shared with me how he incorporates SwingTradeBot's data into his research process. Here's part of our exchange:
Read More ➞Finding Parabolic Stocks (to Short)
I've been thinking a lot about stocks which have undergone parabolic rises based on (what I consider) a lot of hype and little substance. That's been fueled by where the bulk of my trading profits have come from over the last few months -- shorting those type of parabolic moves. (Some call those stocks "flying pigs".)
For example, I've shorted VERI 3 times after the crash through 60:
HMNY:
OSTK 4 times (breaking even on the first 3 attempts but a nice winner on the 4th)
XNET:
XNET was the biggest short-term winner I've had this year...
Thanks $XNET! I only wish I'd doubled down on my short at $24 like I considered. pic.twitter.com/m5TUHO9B5W
— Michael Seneadza (@TraderMike) November 29, 2017

So after that XNET success I really started thinking "I need a way to find these kind of movers quickly." So I'm thinking about adding a "Gone Parabolic" scan. I have some ideas on how to do it. Some criteria:
- Must be above the Upper Bollinger Band
- Must be trending up very strongly (can use ADX and Directional Movement for that determination)
- Must be up over 70% in the last few months
- Must have Overbought Stochastic (almost a certainty if the above are all present)
I'll be playing around with that over the weekend to see what I can come up with. But in the mean time, a pretty good approximation is to use the Percentage Gainers scan, looking at the last 90 days and checking the charts of those stocks which are up more than 70% over that period.
Of course with any of these scans, you'd want to investigate why the stock has been rallying and then decide a course of action.
*** Note that shorting these kind of moves is not for the faint of heart! You can get slaughtered if you jump in too early. So if you want to wade into these waters, be sure to have a well thought out plan and control your risk (scaling in may help).
Read More ➞A Big Change to Alerts / Scans...
You may notice today that you're seeing more alerts listed for a stock than before. That's because I've made a pretty significant change to some things behind the scenes. By sort of an accident of evolution (let's call it), there have always been two classes of alerts (scans / signals) on the site. Old timers will remember that they were listed separately. They used to be called "Individual Pattern Scans" and "Advanced Scans".
Read More ➞New Scan Option: Filter Only *Your* Stocks
The other day somebody asked me if there was a way to run a scan and only see results from his watchlists. There was not, but after discussing it for a while I saw how it could be useful to those who like to trade from a specific set of stocks.
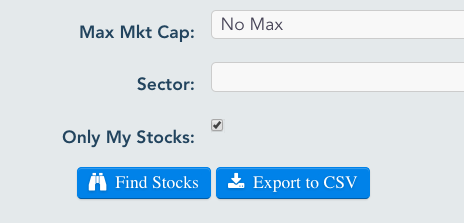
So I've now added the ability to run scans against just the stocks which are in your watchlists and portfolios. Just check the box next to "Only My Stocks" in the form where you enter your scan criteria.
Read More ➞Market Cap Scan Filter Plus More Fundamental Data
I have some good news for the many people who have asked me for a market cap scan filter. As of today you can finally filter by that piece of fundamental data, You'll see a couple of new parameters in the form where you enter your scan criteria. Those news parameters allow you to choose values for a minimum and a maximum market cap.
Read More ➞New Addition: Stats on the Daily Scan Results
I recently added some data which may be helpful in getting a feel for what scans are "trending". I've started tracking the number of stocks which appear on each scan each day. That's enabled the ability to show how much above or below normal a scan is on any given day. You can find this data in two places.
Read More ➞New Scans/Alerts: New CLOSING 52-Week Highs and Lows
Over the last few weeks a few people have asked me if there is a way to differentiate new 52-week intraday highs from closing highs. The "new highs & lows" scans I've had on the site for years were simply alerting to intraday extremes. So I've decided to create a couple of new scans:
The original scans are still here but I've made these new signals/scans replace the old ones with regard to how the system treats them. For example, I used to count a stock making a new 52-week intraday high as a bullish signal. That always bothered me a bit because that same stock could have opened at a new high and sold off horrendously during the day. In a situation like that, the site would still be showing that new high as bullish. Well that won't happen anymore. I've changed the new intraday highs & lows to be neutral signals and the new ones will count as bullish or bearish. Hopefully you'll find these new ones useful.
Read More ➞Customizing Your Stock Screening

I'm sharing an email exchange I had earlier today in hopes that it will help others to find ways to get exactly what they want when using the site to scan for stocks. A friend sent me this:
I was looking through your hammer scans on SwingTradeBot to see how Zillow stacked up on the grading curve. I was surprised Zillow (Z) only got a B. I looked at the A rated puppies and felt like Zillow (Z) should be higher rated. Then I realized what I really want is a modified hammer scan. I want hammers that come at the end of a period of selling, even better if it is an oversold hammer or a hammer coming off a high. The preceding selling has to be at least three straight down days. Did you already read my mind and create such a thing, or do I need to put a suggestion in the idea box? :)
Here's my answer:
Read More ➞Using the Bollinger Band Squeeze Scans
This will cover how to make use of all the Bollinger Band Squeeze-related scans, including:
- Bollinger Band Squeeze Stock Screen
- Bollinger Band Squeeze Started
- Bollinger Band Squeeze Ended
- Bollinger Band Squeeze + Lower Band Touch
- Bollinger Band Squeeze + Upper Band Touch
As you may be able to tell by the names, the last four scans are subsets of the first -- the plain old Bollinger Band Squeeze Scan. So those other four scans will have shorter lists of stocks. We'll see why you might want to use one of those scans instead of the primary BB Squeeze scan.
Read More ➞New Scans: MACD Crossovers!
Recently I've had several people ask me about MACD scans. Well I'm glad to announce that I've just added a few to alert/find MACD crossovers. They are:
Read More ➞Using the Down 3, 4 & 5 Days in a Row Scans
These three scans: Down 3, 4, or 5 Days in a Row, are pretty straight-forward. They do exactly what their names say -- find stocks which have closed lower multiple days in a row.
I like to use these scans to find strong stocks which are in long or intermediate-term uptrends which are experiencing pullbacks. I do that by sorting the results by Grade and then looking at those ranked highest -- A, B, or C. As in the GIF below, after sorting, I'll use the hover/pop-up charts to get a quick veiw of the chart. If it's one I want to explore further, I'll open it in a new browser tab and take a more detailed look after I've gotten through the entire list of scan results.

Combining with other scans
As with most technical analysis signals, they can be enhanced by combining them with other signals/scans or eyeballing the chart for pullbacks to some kind of support (old resistance level turning to support, a trendline or a previous low). So I often look for a confluence of at least two indicators in my trading candidates:
An issue that comes along in the world of pattern recognition is that one signal or trigger to a typical pattern may simply be noise and not an actual signal to an unfolding event. However, when signals begin to line up and you see multiple signals pointing to an outcome you can be more confident in an outcome. When multiple triggers begin to unfold, this is known as confluence and something that traders should look for, to have an edge before entering a trade.
A quick way to find some confluence is to use the Combo Scan. SInce I prefer trading pullbacks, these "Down 3, 4 or 5 Days in a Row" scans are some of my favorites to combine with other scans. Here are some ideas of other scans to combine them with:
- 50 DMA support
- 200 DMA Support
- Calm After Storm
- Doji Bullish
- Hammer Candlestick or Lizard Bullish
- Lower Bollinger Band Touch
- Multiple of 10 Bearish ( could be a bullish setup if the stock snaps back above that multiple of 10 -- or a bearish setup if it follows through)
- Multiple of 10 Bullish
- NR7
Popular Now
Recent Comments
- TraderMike on BOOT
- Dr_Duru on BOOT
- TraderMike on Stochastic Reached Oversold
- SuccessfulGrasshopper897 on Stochastic Reached Oversold
- Cos3 on Adding float as advanced filter criteria?
From the Blog
Blog Tags
Featured Articles