Blog Posts Tagged with Signals
Lessons from My 2023 Trading Results
I want to share what I’ve learned from my 2023 trading but first I’d want to zoom out to a longer term view. Here’s a chart of my trading account’s returns since I moved to Interactive Brokers in 2015:
Read More ➞Even More (Almost) Real-Time Stock Alerts
With the extra volatility these days I'm finding myself checking in on my intraday alerts more frequently. They were a great help in finding some of my favorite names (FSLY & TDOC) bouncing off key levels for day trades last Friday. So I've been thinking of more alerts I could have SwingTradeBot generate. Here's the latest batch:
Read More ➞New Intraday Alerts Functionality
Here's a rundown of a few things I've added around Intraday Alerts:
Read More ➞New Intraday Alerts: StockTwits Trending and Moving Average Bounces
I've released a couple of new intraday alert types over the last several days. All of these were due to people messaging me to suggest I add them. So I'm glad to see that people are finding the intraday alerts useful and that they're suggesting things that I either missed or, in the case of StockTwits, might have never even thought of creating.
Read More ➞How and Why I'm Using the New Intraday Alerts
I want to share how I'm using the newly added intraday alerts. First, a little (refresher) on my typical trading process. Here's what I do for at least 80% of my trades:
Read More ➞New Feature: Intraday Alerts (and a Mobile App Coming Soon!)
Update: The SwingTradeBot mobile app has been released for both Android and iOS.
You may have seen some new links around the site today. I've added some intraday alerts ito the mix. These alerts are *near real time* -- they may be delayed from 1 - 20 minutes. But I think they're still very useful, as long as you're not trying to be a scalper with them.
You'll be able to select from a list of things to which you want to be alerted. This functionality is in beta now and it may be a little buggy. I'll be tweaking things over the next few days. So if you noticed anything weird please let me know.
Oh, I should add that these are only available on the US (Nasdaq, NYSE and Amex) version of the site. That's because that's the only version of the site for which I have intraday quotes. (Edit on May 8th: They are now also available for the Australia/ASX, Canada and UK/LSE markets.) If I can find a reasonbly priced quote source for Canada, Austrailia and the UK, then I'll turn on these alerts for those markets as well.
Here's the initial list of alerts:
Read More ➞Backtesting Using (Google) Spreadsheets and SwingTradeBot
I had a really good email exchange with somebody (Jason) the other day. He shared with me how he incorporates SwingTradeBot's data into his research process. Here's part of our exchange:
Read More ➞A Big Change to Alerts / Scans...
You may notice today that you're seeing more alerts listed for a stock than before. That's because I've made a pretty significant change to some things behind the scenes. By sort of an accident of evolution (let's call it), there have always been two classes of alerts (scans / signals) on the site. Old timers will remember that they were listed separately. They used to be called "Individual Pattern Scans" and "Advanced Scans".
Read More ➞New Scans/Alerts: New CLOSING 52-Week Highs and Lows
Over the last few weeks a few people have asked me if there is a way to differentiate new 52-week intraday highs from closing highs. The "new highs & lows" scans I've had on the site for years were simply alerting to intraday extremes. So I've decided to create a couple of new scans:
The original scans are still here but I've made these new signals/scans replace the old ones with regard to how the system treats them. For example, I used to count a stock making a new 52-week intraday high as a bullish signal. That always bothered me a bit because that same stock could have opened at a new high and sold off horrendously during the day. In a situation like that, the site would still be showing that new high as bullish. Well that won't happen anymore. I've changed the new intraday highs & lows to be neutral signals and the new ones will count as bullish or bearish. Hopefully you'll find these new ones useful.
Read More ➞Using the Bollinger Band Squeeze Scans
This will cover how to make use of all the Bollinger Band Squeeze-related scans, including:
- Bollinger Band Squeeze Stock Screen
- Bollinger Band Squeeze Started
- Bollinger Band Squeeze Ended
- Bollinger Band Squeeze + Lower Band Touch
- Bollinger Band Squeeze + Upper Band Touch
As you may be able to tell by the names, the last four scans are subsets of the first -- the plain old Bollinger Band Squeeze Scan. So those other four scans will have shorter lists of stocks. We'll see why you might want to use one of those scans instead of the primary BB Squeeze scan.
Read More ➞New Scans: MACD Crossovers!
Recently I've had several people ask me about MACD scans. Well I'm glad to announce that I've just added a few to alert/find MACD crossovers. They are:
Read More ➞Using the Down 3, 4 & 5 Days in a Row Scans
These three scans: Down 3, 4, or 5 Days in a Row, are pretty straight-forward. They do exactly what their names say -- find stocks which have closed lower multiple days in a row.
I like to use these scans to find strong stocks which are in long or intermediate-term uptrends which are experiencing pullbacks. I do that by sorting the results by Grade and then looking at those ranked highest -- A, B, or C. As in the GIF below, after sorting, I'll use the hover/pop-up charts to get a quick veiw of the chart. If it's one I want to explore further, I'll open it in a new browser tab and take a more detailed look after I've gotten through the entire list of scan results.

Combining with other scans
As with most technical analysis signals, they can be enhanced by combining them with other signals/scans or eyeballing the chart for pullbacks to some kind of support (old resistance level turning to support, a trendline or a previous low). So I often look for a confluence of at least two indicators in my trading candidates:
An issue that comes along in the world of pattern recognition is that one signal or trigger to a typical pattern may simply be noise and not an actual signal to an unfolding event. However, when signals begin to line up and you see multiple signals pointing to an outcome you can be more confident in an outcome. When multiple triggers begin to unfold, this is known as confluence and something that traders should look for, to have an edge before entering a trade.
A quick way to find some confluence is to use the Combo Scan. SInce I prefer trading pullbacks, these "Down 3, 4 or 5 Days in a Row" scans are some of my favorites to combine with other scans. Here are some ideas of other scans to combine them with:
- 50 DMA support
- 200 DMA Support
- Calm After Storm
- Doji Bullish
- Hammer Candlestick or Lizard Bullish
- Lower Bollinger Band Touch
- Multiple of 10 Bearish ( could be a bullish setup if the stock snaps back above that multiple of 10 -- or a bearish setup if it follows through)
- Multiple of 10 Bullish
- NR7
New Scan: Stocks Making a Cup-with-Handle Pattern
I'm releasing another new scan / signal today. This one finds stocks forming the handle portion of a cup-with-handle pattern. If you're not familiar with the cup & handle, here's a quick overview:
Read More ➞New Scans: Most Alerts, Most Bullish Alerts & Most Bearish Alerts
By popular demand, I'm releasing three new scans today They are:
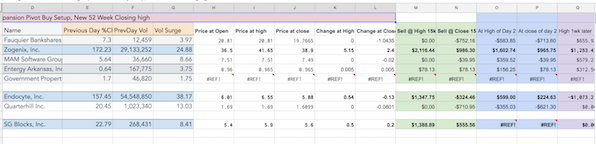
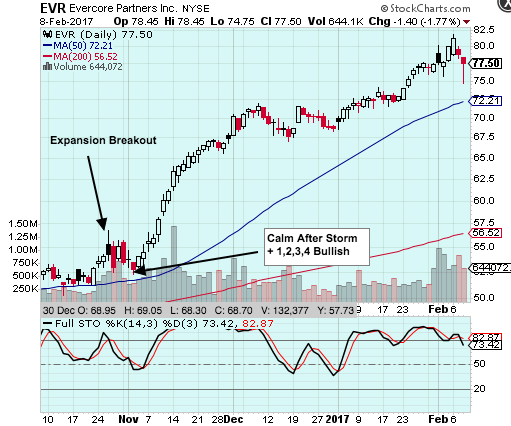
Read More ➞A Look Back at the Signals Which Launched EVR's 40+ Percent Rally...
The other day I was flipping through charts on the top percentage gainers scan and noticed the run EVR has had over the last three months. It's pretty much been straight up (more than 40%) since late October.
Popular Now
Recent Comments
- TraderMike on BOOT
- Dr_Duru on BOOT
- TraderMike on Stochastic Reached Oversold
- SuccessfulGrasshopper897 on Stochastic Reached Oversold
- Cos3 on Adding float as advanced filter criteria?
From the Blog
Blog Tags
Featured Articles