Blog Posts Tagged with Portfolio
New Scan Option: Filter Only *Your* Stocks
The other day somebody asked me if there was a way to run a scan and only see results from his watchlists. There was not, but after discussing it for a while I saw how it could be useful to those who like to trade from a specific set of stocks.
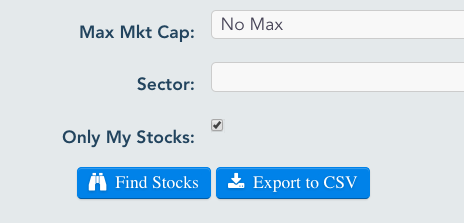
So I've now added the ability to run scans against just the stocks which are in your watchlists and portfolios. Just check the box next to "Only My Stocks" in the form where you enter your scan criteria.
Read More ➞Removing Stocks from Your Watchlist or Portfolio
I just received an email asking me how to remove stocks from a watchlist. It's pretty straight-forward but it may not be obvious if you're using a mobile device. If you're using a desktop or laptop computer (or maybe even a large tablet) you'll see a trash can icon over on the right side of each stock's row. Just click the trash can icon to remove the stock from the list -- note that the table scrolls horizontally & you may have to scroll it to see the trash can icon. The pencil icons allow you to edit the stock's details (The note for a watchlist... stop loss values, number of shares, entry price, etc. for a portfolio).

If you are on a mobile device it a little trickier. For most of the tables on the site, columns get hidden to conserve space on mobile devices. You'll be able to tell when data/columns have been hidden because you'll see a plus sign on the left side of each row. Tapping the plus sign or just tapping anywhere in the row will expand the row and show the hidden columns. Once the row has been expanded you can click the "+" to reveal the trash can. See below:

Swing Trading While having a Full-Time Job on the Side
Every few weeks somebody asks me why SwingTradeBot doesn't provide real-time quotes. My answer is always the following two things:
- They're too expensive. Real-time quotes cost a lot of money if you want to republish them on a website.
- They aren't necessary for swing or position traders.
That second point is what I want to drill down into. IMHO, one of the key benefits of swing trading is that you don't have to watch the market all day long. It's an approach to the market that makes sense for most people, who aren't trading full-time.
I've written about how I use the site to find trading candidates but now I'll detail how I manage my trades. My goal here is to get the computer(s) to do the bulk of the trade management. Computers are great at always being on (hopefully); following directions/rules; not being emotional; not hesitating; doing things quickly & precisely. I want to take advantage of all of those traits.
Just as an example, I'll choose a stock which made a hammer candlestick yesterday -- SKT. I'll typically enter a (buy/long) trade a few cents above the previous day's high and put a stop loss order at or just below the previous day's low. SKT's high & low yesterday were 40.47 and 40.04. I want to see that SKT is moving in 'my' direction before entering a trade so I'm not going to try to buy it until it clears 40.50. I'll do that by using a buy stop limit order with a stop loss attached to it. The 'buy stop limit' tells my broker's computers to watch SKT and enter a LIMIT order if and only if SKT trades at or above the STOP price. I'm going to enter this order with a STOP price of 40.51 and a LIMIT price of 40.60. I'll put my STOP LOSS order at 39.95.
A critical part of order entry is position sizing. I like to use the percent risk position sizing model. Currently I'm risking 0.8% of my account equity per trade. So let's my account equity is $100,000. If I risk 0.8% per trade that means I need to size my position such that if my initial stop loss is hit I should lose approximately $800. ($800 is my initial Risk, or (R) for short... here's more on R and R-Multiples.) Given that the distance (price change) between my max entry price (40.65) and my stop loss (39.95) is 70 cents, I have to divide $800 by $0.70 to get my position size of 1,142 shares. I'll round that up to 1,200 shares. (I'm rounding UP because I expect to get filled closer to 40.51 than 40.65. If I were to get filled at 40.51 my optimal position size should have been 1,400 shares.)
Here's the order entry for matching that:

That's the entry form for my broker -- Interactive Brokers. Stepping through the order entry form from left to right and top to bottom... I chose to BUY 1,200 shares (QTY) with an order type of STOP LIMIT (STP LMT) with a LIMIT price of 40.65 and a STOP price of 40.51. The order will stay "in force" for the day (meaning it will only exist in my broker's system for the NEXT trading day if I entered the order while the market was closed or the CURRENT day if I entered the order while the market was open).
You'll also see that I clicked the "advanced" button, which opened an additional form. That's where I attached a STOP LOSS order. That order will only go live if the attached buy order gets executed. The stop loss order will then be set to trigger a sell (at market price) order if SKT drops to 39.95. Note that the stop loss has GTC (good til canceled) for its time in force. I want the stop loss order to stay active day after day for as long as I'm in the position.
Here's the confirmation for that order:
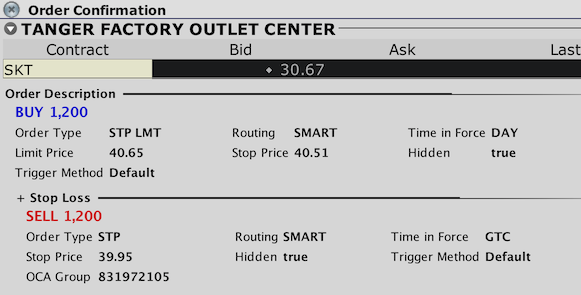
And here's a visual representation of the order on the SKT chart.
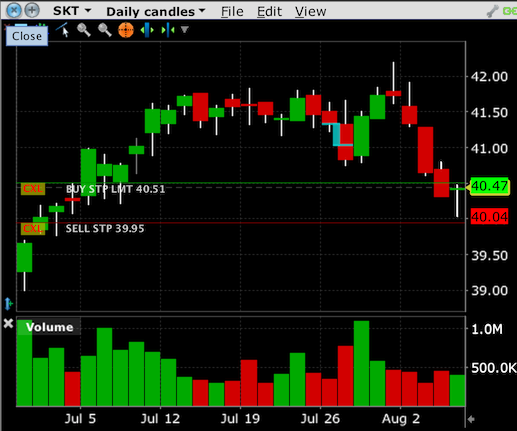
The green line shows where the order goes live -- note the label: 'BUY STP LMT 40.51'. The red line shows where the stop loss will trigger -- note its label: 'SELL STP 39.95'. I always check for these lines on the chart to get a nice visual confirmation of what my order will do. I typically want to see the last day's bar/candlestick bracketed by my entry and exit orders.
You should be able to accomplish that type of order at other brokerages as well. The way you enter it may vary based on the broker's user interface but the results should be the same. Here's how I'd enter the same trade at my other brokerage -- eTrade:

So I go to the "Conditional Orders" page and choose a "One-Triggers-All" order type. For a "One-Triggers-All" order, once the first order executes, the attached order(s) get entered. You can also do some interesting things with eTrade's bracketed orders (trailing stops or profit takers) and contingent orders.
Orders like that allow me to NOT have to watch the market at all during the trading session. I know that my entry order will get executed if the stock hits my entry trigger price and I'll be protected with my stop loss order. What I don't know, though, is if my order will be filled. Because I'm using a LIMIT order to enter the trade it's possible that the order will not be filled or will only be partially filled. That will happen if the stock moves past my limit price too quickly for my order to get executed. I try to prevent that from happening by only trading liquid stocks and by having at a reasonable distance between my BUY STOP PRICE and the LIMIT price.
Once I'm in a position I'll try to stay in it until my stop loss is hit. That could be my initial stop loss -- in this case at 39.95 -- or a trailing stop. If I get 1R ($800) of profit in this trade I'll move my stop loss up to my entry price to ensure that at worst (barring a gap down past my stop or a lot of slippage when I sell) I break even on the trade. Once I reach that point I'll adjust my stop to keep locking in more and more profit as the stock rises. I could enter auto-adjusting trailing stop orders but I prefer to manage "rolling my stops" myself. One stop loss adjusting technique that I often use is the Chandelier Exit:
Developed by Charles Le Beau and featured in Alexander Elder's books, the Chandelier Exit sets a trailing stop-loss based on the Average True Range (ATR). The indicator is designed to keep traders in a trend and prevent an early exit as long as the trend extends. Typically, the Chandelier Exit will be above prices during a downtrend and below prices during an uptrend.
If you've added stocks to your portfolio on SwingTradeBot, you've seen that there's a place to enter your chandelier exit parameters. I typically set my Chandelier Exits to 3 ATRs. Each night when the Bot updates its data and processes alerts, it also recalculates the Chandelier Exit values. So part of my after-market process is to check if I need to adjust my stop loss orders to match their current Chandelier Exit values.
So that's my process for managing trades. It doesn't require me to pay any attention to the market during the trading day. So I can work my day job, be on vacation, be offline, be asleep, etc. and my orders will get executed. This process has worked really well for me over the last few years and I can't imagine going back to staring at quotes & charts all day like I used to do years ago. If and when I do need a real-time quote I simply use by broker's smartphone app.
Read More ➞New Features and Pro Plans
You may have noticed some changes to the site this week. The other day I added three tiers of subscription plans. They are:
- Free Plan - limited set of features
- Gold Plan @ $10/month - Pro set of features
- Platinum Plan @ $17.50/month - Pro set of features+
I've converted all pre-existing users to the Free Plan. Previously users could add an unlimited number of stocks to their watchlist and portfolio. Now the free plan limits you to 5 stocks on your watchlist and 5 stocks on your portfolio. Note that if you had more than 5 stocks on your lists you will still have those stocks in your lists. However, you won't be able to add new stocks to those lists until the list contains fewer than 5 stocks.
The Pro plans provide:
Read More ➞New Feature: Hover Charts for Even Quicker Stock Screen Analysis
Update: Now there's an even faster way to view the charts.
I've just implemented a feature I've wanted since I launched the site. You can now hover your cursor (mouse pointer) over a stock ticker to get a pop up of the chart. (Similar to how FinViz.com pop-up charts work.) Here's an example:

For now this works on all of the stock scan result pages as well as your portfolio and watchlist pages (and one of my favorite pages, the list of recent IPOs). My primary goal with this site is to make my nightly analysis process more efficient and this has already boosted my productivity a lot.
Read More ➞How I Use SwingTradeBot
I created this site to help me manage and speed up my nightly stock research. Here I'll share how I'm currently using the site as a way to help others see how everything here ties together. My process consists of a few general categories:
- Analyzing the broad market
- Finding new trading candidates
- Managing positions that I currently hold
- Managing / monitoring my watchlist
The Ultimate Mobile Phone Stock Market Portfolio App!?
A few months ago I downloaded several stock apps for my iPhone but I wasn't really happy with any of them. Invariably they were either too slow, too clunky or too expensive. Even my broker's app required me to login in every time I launched it! So annoying! What I wanted was something that would let me get a quick overview of my portfolio or watchlist while I was away from my computer. So when I started working on SwingTradeBot making it work well on mobile browsers was very important to me. So far I'm very happy with using it from my phone -- no app required, so it should look (pretty much***) the same on any mobile browser. I also like being able to access it from ANY device and see the same info everywhere.
Here are some screenshots:
Read More ➞Popular Now
Recent Comments
- TraderMike on BOOT
- Dr_Duru on BOOT
- TraderMike on Stochastic Reached Oversold
- SuccessfulGrasshopper897 on Stochastic Reached Oversold
- Cos3 on Adding float as advanced filter criteria?
From the Blog
Blog Tags
Featured Articles