Blog Posts Tagged with Scans
New Scan: Stocks Making a Cup-with-Handle Pattern
I'm releasing another new scan / signal today. This one finds stocks forming the handle portion of a cup-with-handle pattern. If you're not familiar with the cup & handle, here's a quick overview:
Read More ➞New Scans: Most Alerts, Most Bullish Alerts & Most Bearish Alerts
By popular demand, I'm releasing three new scans today They are:
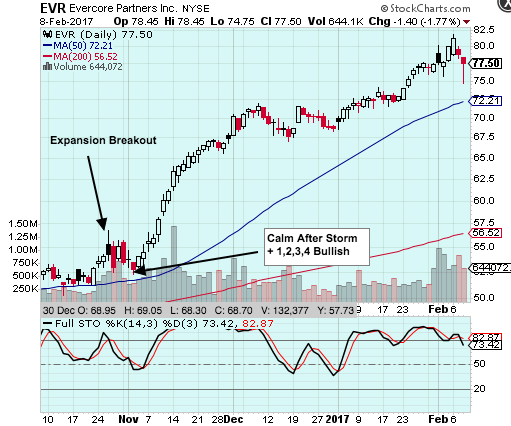
Read More ➞A Look Back at the Signals Which Launched EVR's 40+ Percent Rally...
The other day I was flipping through charts on the top percentage gainers scan and noticed the run EVR has had over the last three months. It's pretty much been straight up (more than 40%) since late October.
New Scan: Stocks Making a Three-Weeks-Tight Pattern
I just added a scan to find stocks making a 3-Weeks-Tight pattern. This is a pattern that Investor's Business Daily / William O'Neil likes a lot. As they describe it:
Read More ➞New Scan: Percentage Change Between Two Dates
Here's another new scan: Percentage Change Between Two Dates
You can choose whether you want to see the best or worst performers over the previous 5, 10, 30, 90 or 365 days.
Read More ➞
New Stock Scans: Upper & Lower Bollinger Band Touches
Here are two new scans I released the other day:
These should be useful to combine with other scans when using the Combination Scan.
Read More ➞How To Save / Bookmark a Combination Scan
I was just asked this:
Would like to reduce the time for scan runs…..I have 4 different Combo scans which would be great to store and run daily. Is there a simple way save the scans and run without manual input?
Here's the answer:
Read More ➞New Stock Scans: Oversold & Overbought Stochastic
I've added a couple of new scans to the site. They are:
Read More ➞The Super Duper Combo Scan is Here!
I just released a feature I've been wanting for a long time. I've also been asked for it by many people. It's essentially a scan of scans. You can now combine up to three scans into one result set. The stocks which will be returned are only those which match all the requested scans.
You'll find it on the main scans page called the 'combo scan'. This will make it even easier & faster to find trading candidates matching your trading style. Simply choose two or three different scans and enter the other criteia as usual.
Read More ➞New Scan: Trends in Multiple Timeframes
I just added another new scan thanks to Rick, who pointed out to me that this functionality was missing. As I told him, I guess I was too close to the forest to see the trees. I should have had this scan a long time ago, given that I've had the trend tables on the stocks since day one. So this scan allows you to find stocks based on what appears in the trend table on the individual stock pages. For example, BERY, which yesterday had this trend table:

- Long-Term Trend: Up
- Intermediate-Term Trend: Up
- Short-Term Trend: Down
New Scans: Rising or Falling Relative Strength Ratings
I just released a couple of new scans. They allow you to identify stocks which have either rising or falling relative strength ratings. The letter grades that you see around the site are essentially relative strength ratings and these scans focus on those grades. Here are the scans:
Read More ➞New Feature: List Stock Scans by Type
 I just made some changes to the way the stock scans are displayed. First, I've moved the "Advanced" scans and combined them with the formerly named "Single Pattern" scans. So when you go to the scans page you'll see all of the scans listed along with the number of stocks that triggered for each scan.
The former Advanced Scans tab now is now "Scans by Type". I've taken a first crack at applying categories / labels / tags to every scan. Drilling down through the scans via those groupings should make it easier to home in on scans matching your particular style / strategy.
FInally, you may have noticed that some of the scans are marked as "Pro" now. People with a Pro (paid) subscription have full access to the results of those scans. If you're not a subscriber, the list of results will be limited for those scans.
I have a list of about 10 new Pro scans that I'll be adding over the next several weeks. So stay tuned for those to pop up.
Read More ➞CLCD: Another Range Expansion-Contraction-Expansion Trade
As another example of how I'm using this SwingTradeBot to find and track good trades, here's one I closed out today: CLCD.

I posted CLCD to my chart notes the night of September 8th after I noticed it on my Calm After Storm scan. (See my blog post about the Calm After Storm scan for my reasoning for creating that scan.) This is a textbook example of the kind of chart I wanted to find when I dreamed up that scan. CLCD made a huge move on the 6th, pulled back on the 7th and on the 8th started showing signs of stabilizing/consolidating. That's what triggered the Calm After Storm.
Read More ➞New Feature: Define Your Tradable Universe of Stocks
People who are subscribed to one of the Pro plans can now specify the default search criteria for all of the scans on this site. I think of this as defining your "tradable universe" of stocks. Until now, by default the scan pages loaded with some settings that I chose -- minimum average volume of 250,000, minimum price of $10/share, stocks only -- no ETFs... If you wanted something different, you had to adjust the settings every time you ran a scan. This new feature will allow you to narrow the scan results down to exactly the type of stocks (and/or ETFs) that match what you're comfortable trading.
Well now you can set your own default values once and have them applied whenever you load a scan with no parameters. You can reach the 'Scan Preferences' page via the main menu. Go to Account -> Settings -> Scan Filter Settings. You'll be presented with the form below.
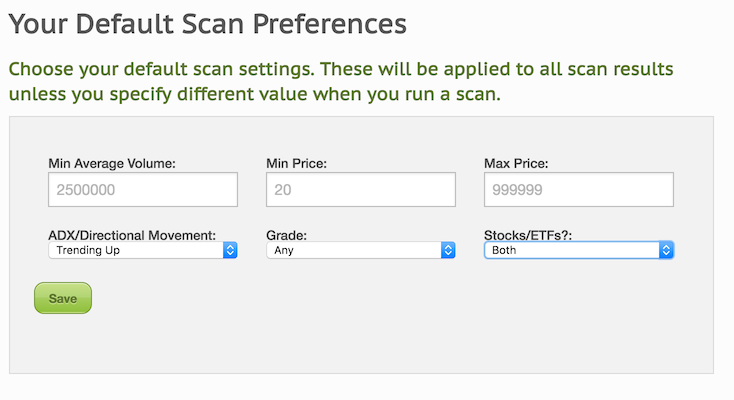
Just choose the values you want and click save. From then on the scan result pages will only show stocks which are in you 'tradable universe'. (Unless you click a link which has different parameters embedded into itself. Some of the links on the site are like that.) You will still be able to manually adjust the parameters if you so choose, just like before.
Read More ➞Finding and Tracking IPOs to Trade
I've been involved in the market for just over 20 years now and some of my best trades have always been in stocks which IPO'd not long before I bought them. That's because those companies (at least the good ones!) are usually very innovative, are (should be) growing quickly, have small floats and once they break to new highs there's no 'natural' overhead supply of sellers. So one of the things I wanted SwingTradeBot to help me with was tracking IPOs. I generally like to jump into IPOs in two different ways:
- as they break out to a new high
- as they pull back and reverse after a big pop on their IPO day
Investors Business Daily (IBD) / CANSLIM is also a big fan of IPOs. Here's a small sampling of what they've written about IPOs: From IPOs Can Be Risky But Profitable
Read More ➞New Features and Pro Plans
You may have noticed some changes to the site this week. The other day I added three tiers of subscription plans. They are:
- Free Plan - limited set of features
- Gold Plan @ $10/month - Pro set of features
- Platinum Plan @ $17.50/month - Pro set of features+
I've converted all pre-existing users to the Free Plan. Previously users could add an unlimited number of stocks to their watchlist and portfolio. Now the free plan limits you to 5 stocks on your watchlist and 5 stocks on your portfolio. Note that if you had more than 5 stocks on your lists you will still have those stocks in your lists. However, you won't be able to add new stocks to those lists until the list contains fewer than 5 stocks.
The Pro plans provide:
Read More ➞Introducing the 'Calm After the Storm' Stock Scan
A few days ago I added a new scan which I'd been thinking about for a while. This scan was motivated by a somewhat tedious process I do almost daily during earnings season. I like to find stocks which have had a strong positive initial post-earnings response and then sell off a bit before rebounding. In order find those stocks I would look at the Earnings Movers scan for each of the previous 5 days or so. I would quickly look at those charts (using the hover charts feature) and then more closely inspect any stocks that were setting up to my liking.
The recent action in Shopify (SHOP) is a great example of the type of action I'm trying to find. I happened to catch SHOP setting up intraday on February 19th and I bought some when I saw it rebounding from the lows of the day. Here's the chart:
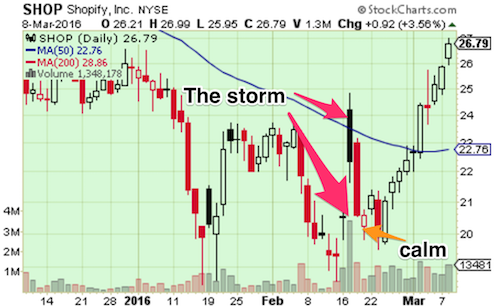
As you can see SHOP gapped up after earnings on the 17th and sold off the rest of the day (a gap & trap). It continued to sell off the next day and closed the gap from the previous day. (Closing the gap isn't a requirement but in this case I took it as a plus.) The action on the 19th (an open narrow-range candlestick after two long/tall dark/closed candlesticks) gave me confidence that the selling was over and that SHOP *might* try to mount a rebound back to the post-earnings high. This is a classic case of volatility swinging from high to low and (hopefully) back to high again. Obviously that trade worked out quite well -- I'm still holding SHOP today with approximately 30% gain.
I see this type of setup a lot but often not until after the rebound move is already underway. So I wanted to create a scan which would unearth these setups for me. That scan is what I'm calling the "Calm After Storm". Here's what it finds:
Read More ➞New Feature: Hover Charts for Even Quicker Stock Screen Analysis
Update: Now there's an even faster way to view the charts.
I've just implemented a feature I've wanted since I launched the site. You can now hover your cursor (mouse pointer) over a stock ticker to get a pop up of the chart. (Similar to how FinViz.com pop-up charts work.) Here's an example:

For now this works on all of the stock scan result pages as well as your portfolio and watchlist pages (and one of my favorite pages, the list of recent IPOs). My primary goal with this site is to make my nightly analysis process more efficient and this has already boosted my productivity a lot.
Read More ➞How I Use SwingTradeBot
I created this site to help me manage and speed up my nightly stock research. Here I'll share how I'm currently using the site as a way to help others see how everything here ties together. My process consists of a few general categories:
- Analyzing the broad market
- Finding new trading candidates
- Managing positions that I currently hold
- Managing / monitoring my watchlist
What the Stock Ratings (Grades) Mean
When viewing a stock's page or a scan results listing you'll see a rating for each stock. That rating will be A, B C, D or F. You can think of these ratings as basically a relative strength rating. The bot ranks all of the stocks according to a proprietary algorithm and then assigns A grades to the top 20%, B grades to the next 20% and so on.
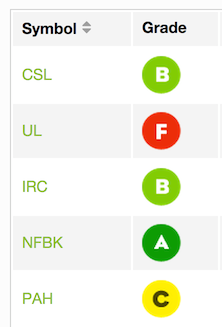
As of this writing, the algorithm only takes technical factors into account. I hope to fold in some fundamental elements into the mix in the near future. It's important to note that these ratings are *not* predicting any future actions -- they're backward looking.
How I use the Ratings:
I use the ratings as a quick way to see if a stock is strong or weak. I like to buy strength and sell weakness, so when I'm looking for stocks to buy I'll filter my stock scan results to only show me A's or B's (and maybe C's). Conversely, when I'm looking for short sale candidates, I'll filter the scan results to only show me D's and F's (and maybe C's).
Read More ➞Popular Now
Recent Comments
- TraderMike on IZM
- SuccessfulGerbil321 on IZM
- TraderMike on IZM
- TraderMike on Today's Outage
- Crunching_The_Market on Today's Outage
From the Blog
Blog Tags
Featured Articles