Using the Bollinger Band Squeeze Scans
June 06, 2017
This will cover how to make use of all the Bollinger Band Squeeze-related scans, including:
- Bollinger Band Squeeze Stock Screen
- Bollinger Band Squeeze Started
- Bollinger Band Squeeze Ended
- Bollinger Band Squeeze + Lower Band Touch
- Bollinger Band Squeeze + Upper Band Touch
As you may be able to tell by the names, the last four scans are subsets of the first -- the plain old Bollinger Band Squeeze Scan. So those other four scans will have shorter lists of stocks. We'll see why you might want to use one of those scans instead of the primary BB Squeeze scan.
What are Bollinger Bands?
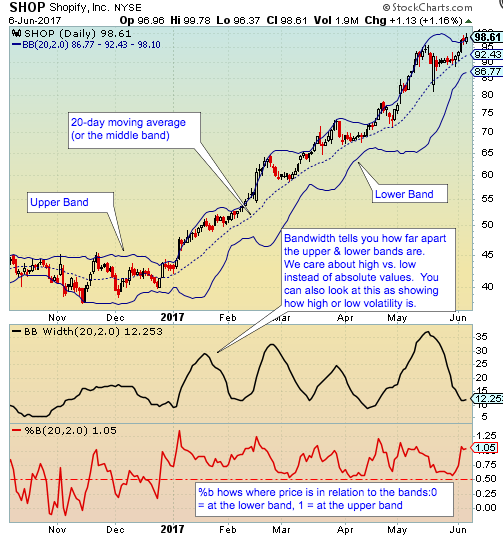
Bollinger Bands are a type of trading envelope (they envelope price). An envelope simple plots lines above & below a stock's price based on some criteria. Bollinger Bands, developed by John Bollinger, consist of three lines: a moving average, a line plotted X standard deviations above that moving average and a line plotted the same number of standar deviations below that moving average. The standard settings for those lines, which SwingTradeBot uses, are a 20-day moving average and 2 standard deviations. Sometimes the moving average will be referred to as the "middle band".
The bands provide a few functions. First, they give us a relative definition of high & low. Low is considered to be at or near the lower band, while high is at or near the upper band. You can also think of them as as oversold and overbought but I'd caution about using tags of an upper band in & of itself as a sell signal or vice versa with the lower band. You'll often see the bands "open up" and let price rise along the upper band or fall along the lower band (called Walking the Bands).
The bands also clearly display when prices are in phases of high or low volatility. Here's a chart showing the bands plus the BandWidth and %b indicators:
Bollinger Band Squeezes
The graph of BandWidth above shows how price can cycle between periods of high & low volatility. Those phases or cycles are what these BB Squeeze scans help us identify. To quote John Bollinger (from his book: Bollinger on Bollinger Bands):
Bollinger Bands are driven by volatility, and The Squeeze is a pure reflection of that volatility. When volatility falls to historically low levels, The Squeeze is on. An indicator called BandWidth was created in order to measure The Squeeze. BandWidth depicts volatility as a function of the average.
The Squeeze has several definitions. The simplest one is that a Squeeze is triggered when BandWidth drops to its lowest level in six months.
For some years there has been an academic theory in circulation that suggests that while price is neither cyclical nor forecastable, volatility is both. The most important aspect of this theory of volatility, that low volatility begets high volatility, and high volatility begets low. If it is a quiet day, expect a storm. If it is a stormy day, expect quiet.
(That last paragraph must have been in my head when I created & named my "Calm After Storm" scan.)
SwingTradeBot's Bollinger Band Squeeze scans/signals are based off of the definition above: BandWidth must be near its lowest levels in the last 6 months. As you'll see if you look at some of the scan results, sometimes that 6-month low doesn't result in an impressive tightening of the bands. If you don't see an obvious tightening in the bands I'd say to just skip that stock. Here are a couple of charts showing Squeezes:
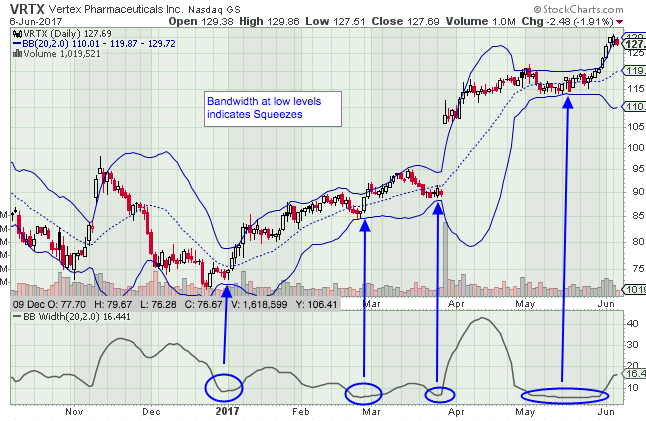

To quote Bollinger again:
An important use of BandWidth is to mark the beginning of directional trends, either up or down. Many trends are born in trading ranges when the BandWidth is quite narrow. A breakout from the trading range that is accompanied by a sharp expansion in BandWidth is often the mark of the beginning of a sustainable trend
However, note that not all of those squeezes turned into big expansions in volatilty. There are no guarantees of what will happen once a Squeeze ends! A Squeeze in & of itself will not predict direction of the move out of the consolidation zone. Nor does it guarantee high volatility is coming. Volatitlity could simply gradually increase.
Using the Squeeze as a Trade Setup
A Squeeze is simply a precondition for a possible volatility breakout. John Bollinger has laid out some simple steps for trading based on a Squeeze:
-
Use the Squeeze as a setup.
-
Then go with an expansion in volatility.
-
Beware the head fake. (An attempted move lower will reverse higher. That attempted breakdown may often also touch or break below the lower band. You'll see the opposite for attempted breakouts.)
-
Use volume indicators for direction clues. (Is volume picking up on up days? Is Accumulation/Distribution turning up? Does the range narrow on down days? What is the relationship of the open to the close? Each piece of evidence helps forecast the direction of the resolution. )
Perhaps the simplest thing to do is place a buy stop above (or a sell-short stop below) a price consolidation zone of a stock in a Squeeze. As mentioned above, though, you may encounter some headfakes. Mr. Bollinger suggests using volume indicators to help forecast the true direction of a breakout/breakdown.
Another idea is to simply buy at or near the lower band. I'll sometimes do that for a stock which had a big post-earnings rally and has subsequently slipped into a squeeze while consolidating those gains. Those type of stocks will be in strong, clear longer-term uptrends. If the stock approached the lower band and the lower band stays flat I'll consider buying near the lower band with a stop loss order not far below the lower band. (I'd reverse all of that for shorts.)
Using The Scans
- Bollinger Band Squeeze
- This finds all stocks currently in a Squeeze. These stocks may not be ready to be traded, as they are simply consolidating. One thing I like to do with this scan is look at the highly rated stocks (A & B grades) to see if any of those charts are close to breaking out. And sometimes it's simply to see if there are any high-profile stocks in a Squeeze. I'll add those to a watchlist so I can pinpoint an entry in the coming days.
- Bollinger Band Squeeze Started
- This will find stocks which are starting a Squeeze (on the chosen date). The list of stocks will be considerably shorter than the primary Squeeze scan. So this is a quick way to see what's been added to the Squeeze list.
- Bollinger Band Squeeze Ended
- This will find stocks which are ending a Squeeze (on the chosen date). As mentioned above, this doesn't guarantee that the stock is starting a big move. I check this list to find stocks which are actually moving out of their trading ranges. One thing I like to see is the upper band turning higher (for a breakout) or the lower band turning down (for a breakdown).
- Bollinger Band Squeeze + Lower Band Touch
- This scan can be useful in a couple of ways: An early warning of a breakdown or identifying a possible headfake lower (a buy on a bounce candidate). I like to use a stock's Grade (its relative strength) while viewing these stocks.
- For weaker stocks (grades D & F) I'll look at the tag of the band as a sign of a coming breakdown. Even better if the stock closed near its lows or if the lower band has started to turn down.
- If the market is strong and a stock has an A or B rating I'll be looking at the touch as a headfake lower. I'll then look for some other sign(s) to confirm my suspicion of move higher. That could be a reversal candlestick or a bounce off of a moving average.
- This scan can be useful in a couple of ways: An early warning of a breakdown or identifying a possible headfake lower (a buy on a bounce candidate). I like to use a stock's Grade (its relative strength) while viewing these stocks.
- Bollinger Band Squeeze + Upper Band Touch
- Basically the opposite of the Squeeze + Lower Band Touch Scan. I'll use this scan to find weak (D & F rated) stocks to short or to find potential breakout on stronger (A or B rated) stocks.
- For the stronger stocks I'll treat at the tag of the band as a sign of a coming breakout. Positive signs would be if the stock closed near its highs or if the upper band has started to turn up.
- If the market is weak or listless and a stock has an D or F rating I'll be looking at the touch as a just a headfake. I'll then look for some other sign(s) to confirm my suspicion of move lower. That could be a reversal candlestick or hitting resistance at a moving average.
- Basically the opposite of the Squeeze + Lower Band Touch Scan. I'll use this scan to find weak (D & F rated) stocks to short or to find potential breakout on stronger (A or B rated) stocks.
Combining with Other Scans
Here are some ideas for other scans you could pair with the Bollinger Band Squeeze scans in a Combo Scan:
- 1,2,3 Pullback Bullish
- 1,2,3 Retracement Bearish
- 50 DMA Support
- 50 DMA Resistance
- 200 DMA Support
- 200 DMA Resistance
- Bearish Engulfing
- Bullish Engulfing
- Rose Above 50 or 200 DMA
- Fell Below 50 or 200 DMA
- Hammer Candlestick
- Shooting Star Candlestick
- Any of the MACD Crosses
- NR7 or Narrow Range Bar might be useful to combine with an upper or lower band touch if looking for headfakes.
scans screens Bollinger Bands bollinger band squeeze signals pullbacks
Comments
SwingTradeBot about 3 years ago
Is there a link that I can use the the BB width squeeze and run it and find the list of stocks that are having BB width squeeze
Thank
View full discussion...
Popular Now
Recent Comments
- TraderMike on BOOT
- Dr_Duru on BOOT
- TraderMike on Stochastic Reached Oversold
- SuccessfulGrasshopper897 on Stochastic Reached Oversold
- Cos3 on Adding float as advanced filter criteria?
From the Blog
Blog Tags
Featured Articles