How to Get a Read on the Market
November 02, 2016
As a long time CANSLIM fan, I'm a firm believer in the importance of the 'M' part of that acronym - "Market Direction". According to IBD:
if the overall market is in a downtrend, it will be very hard for even the best stocks to move higher. That's because 3 of 4 stocks move in the same direction as the general market, either up or down.
(The "general market" refers to the major indexes, primarily the Nasdaq Composite, S&P 500 and Dow Jones Industrial Average.)
Simply put: If you buy a stock when the market is in a strong uptrend, you have a 75% chance of being right. But if you buy when the market is in a downtrend, you have a 75% chance of being wrong.
It's critical to me to have a read on what the broad market is doing. I used to use IBD's 'Big Picture' to get my market read but I find that I can reach the same conclusions using my General Market Analysis page. I've written before about how I use the General Market Overview page to get a read on the market as a whole. Last week I pointed out in my notes last week how choppy & trendless the market was looking. I want to go a little deeper into what it's telling me today.
Here's the trend table for the indices from today's General Market Analysis page: 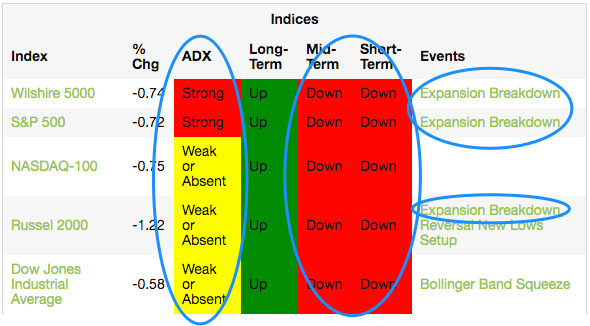
Like I said last week, that trend table makes it very obvious that the short and intermediate term trends are down while the long-term trend is up on all the indices. That alone gives a trader a ton of valuable information. If you trade with the trend then, unless you're a long-term trader (investor?), you probably should not be initiating long positions right now. If you're willing to play the short side that is the path of least resistance for short and intermediate-term trades.
I also find the ADX column interesting. It's showing strong downtrends on the S&P 500 and Wilshire 5000 and non-existent trends on the other indices. ADX is "The Trend Strength Indicator" -- SwingTradeBot uses the default setting of 14 bars (days) to calculate ADX. It's important to note that ADX is a lagging indicator, so it's not going to get you in at the start of a trend but it can confirm trendiness and the strength of trends. The other thing that stands out to me today is the "Expansion Breakdown" alerts on the S&P 500, Russell 2000 and Wilshire 5000. That means that those indexes made new 2-month lows with the largest range in almost 2 weeks... So there's not a lot for bulls to like in the market right now based on that trend table. 
One of my favorite indicators on that page is the Percent of Stocks Above their 50-day Moving Averages. Most of the time this indicator isn't very interesting, but once it hits certain levels it's critical to heed its message! This is similar to Worden's T2108 indicator that I used to blog about way back in the day. T2108 uses the 40-day moving average while I'm using the 50 DMA, so my critical level is a little higher than T2108's. This indicator serves as an overbought/oversold indicator (I like it much better as an oversold indicator). Once my version gets into the low 20s that's a good sign the market is very oversold.
Another good piece of information on the General Market page is the chart of new 52-week highs vs. new 52-week lows. We had 86 new highs today vs. 265 new lows! Not what you want to see if you're a bull.

You can quickly see the charts of the indices on the General Market page via the hover charts. Every day I make sure to take a look at the charts of all the indices in the trend table. For the last several week those charts have told a similar story of choppy sideways-to-down action. Here's my read on three of the indices:


Note that the 200-day moving averages aren't very far away for the indices (aside from the Nasdaq). In my note the other day I mentioned the long-term trend possibly pushing the shorter term trends upward. I can easily see a scenario where the indices are perched very close to the 200-day moving averages just before the election next week. The market often seems to end up at critical technical junctures for events like that.
The 200-day averages are supposed to be where long-term players like mutual funds put money to work, so if we get to those lines the action will be very telling.
My modus operandi for the last few weeks, given the chop, has been to do less and less as far as actual trades. I never like to initiate a lot of trades during the heart of earnings season anyway because the market is so news driven. So I've been content to simply curate my watchlists and wait for something to spark a move out of the choppiness. I (of course) have no clue which direction the chop will resolve. My guess is that we'll see a post-election bounce (which might start ahead of election day) but who knows if that will be anything more than just a short-overing relief rally.
So that's a glance into how I continue to leverage the General Market Analysis page to quickly get a feel for the market. Starting with this high level read often keeps me out of trouble since it puts the overall market's direction (or lack thereof) at the front of my mind before I go looking for trending candidates that may not be in alignment with the market.
site features moving averages Technical Analysis indices
Comments
SwingTradeBot about 8 years ago
Thanks. I also linked to your T2108 page in this blog post.
SwingTradeBot about 8 years ago
Great stuff. Thanks for pointing out that the indices are converging upon tests of 200DMA support right on time for the election. Given your mention of T2108, "have to" add a shameless plug for my analysis of T2108, the percentage of stocks trading above their respective 40DMAs... :) http://drduru.com/onetwenty...
View full discussion...
Popular Now
Recent Comments
- TraderMike on BOOT
- Dr_Duru on BOOT
- TraderMike on Stochastic Reached Oversold
- SuccessfulGrasshopper897 on Stochastic Reached Oversold
- Cos3 on Adding float as advanced filter criteria?
From the Blog
Blog Tags
Featured Articles