Blog Posts Tagged with Trading Tips
How Bollinger Bands (and Stochastic) Helped Navigate the Market in 2018
I meant to write this over the weekend when I was going through charts and noticed how the S&P 500 has been bouncing between its upper and lower Bollinger Bands since February. So here's the chart, which I've annotated to identify some key turning points (you can click the chart to get a larger version):
Read More ➞Swing Trading While having a Full-Time Job on the Side
Every few weeks somebody asks me why SwingTradeBot doesn't provide real-time quotes. My answer is always the following two things:
- They're too expensive. Real-time quotes cost a lot of money if you want to republish them on a website.
- They aren't necessary for swing or position traders.
That second point is what I want to drill down into. IMHO, one of the key benefits of swing trading is that you don't have to watch the market all day long. It's an approach to the market that makes sense for most people, who aren't trading full-time.
I've written about how I use the site to find trading candidates but now I'll detail how I manage my trades. My goal here is to get the computer(s) to do the bulk of the trade management. Computers are great at always being on (hopefully); following directions/rules; not being emotional; not hesitating; doing things quickly & precisely. I want to take advantage of all of those traits.
Just as an example, I'll choose a stock which made a hammer candlestick yesterday -- SKT. I'll typically enter a (buy/long) trade a few cents above the previous day's high and put a stop loss order at or just below the previous day's low. SKT's high & low yesterday were 40.47 and 40.04. I want to see that SKT is moving in 'my' direction before entering a trade so I'm not going to try to buy it until it clears 40.50. I'll do that by using a buy stop limit order with a stop loss attached to it. The 'buy stop limit' tells my broker's computers to watch SKT and enter a LIMIT order if and only if SKT trades at or above the STOP price. I'm going to enter this order with a STOP price of 40.51 and a LIMIT price of 40.60. I'll put my STOP LOSS order at 39.95.
A critical part of order entry is position sizing. I like to use the percent risk position sizing model. Currently I'm risking 0.8% of my account equity per trade. So let's my account equity is $100,000. If I risk 0.8% per trade that means I need to size my position such that if my initial stop loss is hit I should lose approximately $800. ($800 is my initial Risk, or (R) for short... here's more on R and R-Multiples.) Given that the distance (price change) between my max entry price (40.65) and my stop loss (39.95) is 70 cents, I have to divide $800 by $0.70 to get my position size of 1,142 shares. I'll round that up to 1,200 shares. (I'm rounding UP because I expect to get filled closer to 40.51 than 40.65. If I were to get filled at 40.51 my optimal position size should have been 1,400 shares.)
Here's the order entry for matching that:

That's the entry form for my broker -- Interactive Brokers. Stepping through the order entry form from left to right and top to bottom... I chose to BUY 1,200 shares (QTY) with an order type of STOP LIMIT (STP LMT) with a LIMIT price of 40.65 and a STOP price of 40.51. The order will stay "in force" for the day (meaning it will only exist in my broker's system for the NEXT trading day if I entered the order while the market was closed or the CURRENT day if I entered the order while the market was open).
You'll also see that I clicked the "advanced" button, which opened an additional form. That's where I attached a STOP LOSS order. That order will only go live if the attached buy order gets executed. The stop loss order will then be set to trigger a sell (at market price) order if SKT drops to 39.95. Note that the stop loss has GTC (good til canceled) for its time in force. I want the stop loss order to stay active day after day for as long as I'm in the position.
Here's the confirmation for that order:
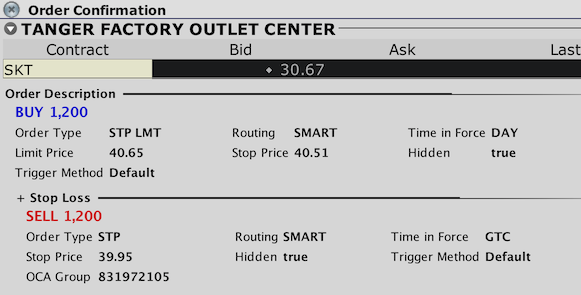
And here's a visual representation of the order on the SKT chart.
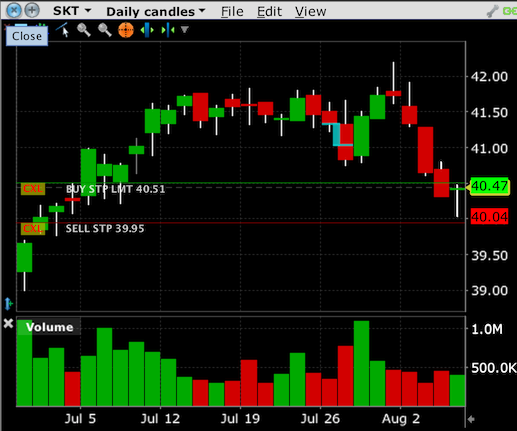
The green line shows where the order goes live -- note the label: 'BUY STP LMT 40.51'. The red line shows where the stop loss will trigger -- note its label: 'SELL STP 39.95'. I always check for these lines on the chart to get a nice visual confirmation of what my order will do. I typically want to see the last day's bar/candlestick bracketed by my entry and exit orders.
You should be able to accomplish that type of order at other brokerages as well. The way you enter it may vary based on the broker's user interface but the results should be the same. Here's how I'd enter the same trade at my other brokerage -- eTrade:

So I go to the "Conditional Orders" page and choose a "One-Triggers-All" order type. For a "One-Triggers-All" order, once the first order executes, the attached order(s) get entered. You can also do some interesting things with eTrade's bracketed orders (trailing stops or profit takers) and contingent orders.
Orders like that allow me to NOT have to watch the market at all during the trading session. I know that my entry order will get executed if the stock hits my entry trigger price and I'll be protected with my stop loss order. What I don't know, though, is if my order will be filled. Because I'm using a LIMIT order to enter the trade it's possible that the order will not be filled or will only be partially filled. That will happen if the stock moves past my limit price too quickly for my order to get executed. I try to prevent that from happening by only trading liquid stocks and by having at a reasonable distance between my BUY STOP PRICE and the LIMIT price.
Once I'm in a position I'll try to stay in it until my stop loss is hit. That could be my initial stop loss -- in this case at 39.95 -- or a trailing stop. If I get 1R ($800) of profit in this trade I'll move my stop loss up to my entry price to ensure that at worst (barring a gap down past my stop or a lot of slippage when I sell) I break even on the trade. Once I reach that point I'll adjust my stop to keep locking in more and more profit as the stock rises. I could enter auto-adjusting trailing stop orders but I prefer to manage "rolling my stops" myself. One stop loss adjusting technique that I often use is the Chandelier Exit:
Developed by Charles Le Beau and featured in Alexander Elder's books, the Chandelier Exit sets a trailing stop-loss based on the Average True Range (ATR). The indicator is designed to keep traders in a trend and prevent an early exit as long as the trend extends. Typically, the Chandelier Exit will be above prices during a downtrend and below prices during an uptrend.
If you've added stocks to your portfolio on SwingTradeBot, you've seen that there's a place to enter your chandelier exit parameters. I typically set my Chandelier Exits to 3 ATRs. Each night when the Bot updates its data and processes alerts, it also recalculates the Chandelier Exit values. So part of my after-market process is to check if I need to adjust my stop loss orders to match their current Chandelier Exit values.
So that's my process for managing trades. It doesn't require me to pay any attention to the market during the trading day. So I can work my day job, be on vacation, be offline, be asleep, etc. and my orders will get executed. This process has worked really well for me over the last few years and I can't imagine going back to staring at quotes & charts all day like I used to do years ago. If and when I do need a real-time quote I simply use by broker's smartphone app.
Read More ➞Finding and Tracking IPOs to Trade
I've been involved in the market for just over 20 years now and some of my best trades have always been in stocks which IPO'd not long before I bought them. That's because those companies (at least the good ones!) are usually very innovative, are (should be) growing quickly, have small floats and once they break to new highs there's no 'natural' overhead supply of sellers. So one of the things I wanted SwingTradeBot to help me with was tracking IPOs. I generally like to jump into IPOs in two different ways:
- as they break out to a new high
- as they pull back and reverse after a big pop on their IPO day
Investors Business Daily (IBD) / CANSLIM is also a big fan of IPOs. Here's a small sampling of what they've written about IPOs: From IPOs Can Be Risky But Profitable
Read More ➞Holiday Reading: MaoXian's Trading for Dummies Series
For those who used to read my old site you know that I'm a huge fan of what's come to be known as the "Dummy" style of trading. I wrote a lot about it back in the day. In my mind the tenets of that style are, to quote myself (there's a lot more detail over there):
Read More ➞
- Keep It Simple, Stupid (KISS)
- Trade with the trend
- Trade only active, liquid stocks
- Define any risk
- Manage risk by adjusting a stop loss order.
- Always enter a protective stop loss order
- Always trade with good reward-to-risk profiles
- Have a well-defined plan and stick to it
Popular Now
Recent Comments
- TraderMike on BOOT
- Dr_Duru on BOOT
- TraderMike on Stochastic Reached Oversold
- SuccessfulGrasshopper897 on Stochastic Reached Oversold
- Cos3 on Adding float as advanced filter criteria?
From the Blog
Blog Tags
Featured Articles