Technical Analysis for ADBE - Adobe Systems Incorporated
| ADX | Long Term | Intermediate Term | Short Term |
|---|---|---|---|
| Strong | Down | Down | Down |
| Date | Alert Name | Type | % Chg |
|---|---|---|---|
| 50 DMA Resistance | Bearish | 0.00% | |
| 20 DMA Support | Bullish | 0.00% | |
| Outside Day | Range Expansion | 0.00% | |
| Gapped Up | Strength | 0.00% | |
| 20 DMA Support | Bullish | -0.02% | |
| NR7 | Range Contraction | -0.02% | |
| NR7-2 | Range Contraction | -0.02% | |
| Gapped Down | Weakness | -0.02% | |
| NR7 | Range Contraction | 0.00% | |
| Down 3 Days in a Row | Weakness | 0.00% |
| Alert | Time |
|---|---|
| 20 DMA Support | about 20 hours ago |
| Outside Day | about 21 hours ago |
| Fell Below Previous Day's Low | about 21 hours ago |
| 60 Minute Opening Range Breakdown | about 22 hours ago |
| Fell Below 20 DMA | about 22 hours ago |
Free Daily (Stock) Chart Reading
- Earnings date: 12/11/2024
Adobe Systems Incorporated Description
Adobe Systems Incorporated operates as a diversified software company worldwide. The company operates in three segments: Digital Media, Digital Marketing, and Print and Publishing. The Digital Media segment provides tools and solutions that enable individuals, small businesses, and enterprises to create, publish, promote, and monetize their digital content anywhere. Its flagship product includes Adobe Creative Cloud, which is an ongoing membership service that lets customers to download and install the latest version of the company's Adobe Creative Suite desktop products and other creative software. This segment serves traditional content creators, Web application developers, and digital media professionals, as well as their management in marketing departments and agencies, companies, and publishers. The Digital Marketing segment provides solutions and services for how digital advertising and marketing are created, managed, executed, measured, and optimized. This segment provides analytics, social, targeting, media optimization, and experience management solutions through its Adobe Marketing Cloud, which helps to manage and optimize online, offline, digital, and multi-channel business initiatives. Its customers include digital marketers, advertisers, publishers, merchandisers, Web analysts, chief marketing officers, and chief revenue officers. The Print and Publishing segment provides products and services that address diverse market opportunities, including eLearning solutions, technical document publishing, Web application development, and high-end printing. It offers Adobe PostScript and Adobe PDF printing technologies; and licenses its technology to original equipment manufacturers (OEMs). The company distributes its products through a network of distributors, value-added resellers, systems integrators, independent software vendors, retailers, and OEMs. Adobe Systems Incorporated was founded in 1982 and is headquartered in San Jose, California.
Classification
Sector: Technology
Industry: Software - Application
Keywords: S&P 500 Nasdaq 100 Software Systems Integrator Digital Media Digital Marketing Printing Work From Home Application Software Web Application Software Vendors Digital Advertising Content Management Systems Application Developers Pdf Experience Management Solutions Printing Technologies Web Application Development
| Indicator | Bull Case | Neutral / Hold | Bear Case |
|---|---|---|---|
| 50 DMA | |||
| 200 DMA | |||
| ADX Trend | |||
| Oversold / Overbought | |||
| Relative Strength |
SensitiveApe144 over 1 year ago
I subscribed last year to an analytical service supposedly based on neural networks AI and claiming 85% accuracy. I lost money over 12 months and did not renew. To me, the claim of 'neural network' AI is equivalent to "Black Box", i.e., 'Trust me', but that's not Generative AI.
SwingScalp over 1 year ago
SwingScalp over 1 year ago
TraderMike over 1 year ago
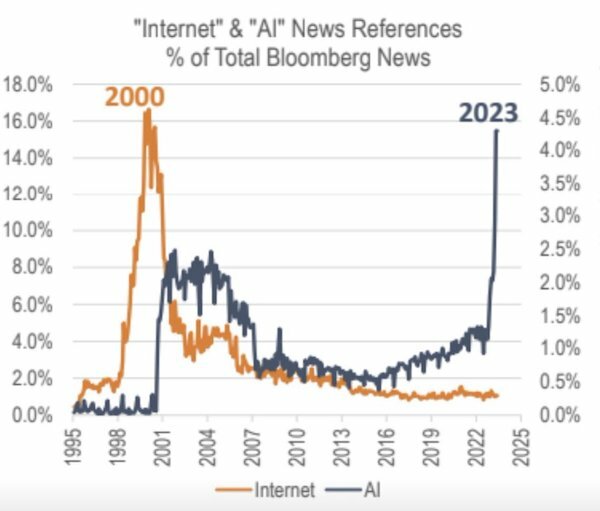
But I still think too many companies are hyping their AI-ness. I saw this the other day on Twitter, which took me back to the dot-com bubble:
TraderMike over 1 year ago
View full discussion...
| Indicator | Value |
|---|---|
| 52 Week High | 638.25 |
| 52 Week Low | 433.97 |
| Average Volume | 3,146,854 |
| 200-Day Moving Average | 519.74 |
| 50-Day Moving Average | 505.27 |
| 20-Day Moving Average | 497.20 |
| 10-Day Moving Average | 509.09 |
| Average True Range | 12.89 |
| RSI (14) | 47.92 |
| ADX | 25.14 |
| +DI | 25.55 |
| -DI | 21.53 |
| Chandelier Exit (Long, 3 ATRs) | 501.26 |
| Chandelier Exit (Short, 3 ATRs) | 513.71 |
| Upper Bollinger Bands | 529.43 |
| Lower Bollinger Band | 464.98 |
| Percent B (%b) | 0.54 |
| BandWidth | 12.96 |
| MACD Line | 1.19 |
| MACD Signal Line | 0.10 |
| MACD Histogram | 1.0933 |
| Pivot Point Level | Traditional / Classic | Fibonacci | Demark | Woodie | Camarilla |
|---|---|---|---|---|---|
| Resistance 4 (R4) | 517.13 | ||||
| Resistance 3 (R3) | 517.45 | 511.91 | 514.19 | ||
| Resistance 2 (R2) | 511.91 | 507.42 | 511.74 | 513.21 | |
| Resistance 1 (R1) | 505.70 | 504.65 | 502.93 | 505.38 | 512.23 |
| Pivot Point | 500.16 | 500.16 | 498.77 | 499.99 | 500.16 |
| Support 1 (S1) | 493.95 | 495.67 | 491.18 | 493.63 | 486.77 |
| Support 2 (S2) | 488.41 | 492.90 | 488.24 | 485.79 | |
| Support 3 (S3) | 482.20 | 488.41 | 484.81 | ||
| Support 4 (S4) | 481.88 |