How I Use SwingTradeBot
I created this site to help me manage and speed up my nightly stock research. Here I'll share how I'm currently using the site as a way to help others see how everything here ties together. My process consists of a few general categories:
- Analyzing the broad market
- Finding new trading candidates
- Managing positions that I currently hold
- Managing / monitoring my watchlist
Because I'm a technical analysis based trader, at the heart of SwingTradeBot are technical alerts. After every trading day the site updates each stock's prices and determines which of the technical patterns which we track occurred on each stock that day. That process usually finishes by 6 pm New York time so I start my analysis some time after 6. (For the non-US markets the nightly update takes place 2 to 4 hours after that market closes.)
You'll see the results of that nightly processing on the stock scan results pages, on each stock's page and on certain other pages, like the bottom of the recent IPOs page and the industry and sector pages (e.g. here's the semiconductor industry page and the healthcare sector page).
The technical analysis scan results also appear on what I consider to be the most important pages of the site -- each user's portfolio and watchlist pages. It's on these pages where you can quickly get a feel for how your stocks stocks are acting technically.
Analyzing the Broad Market
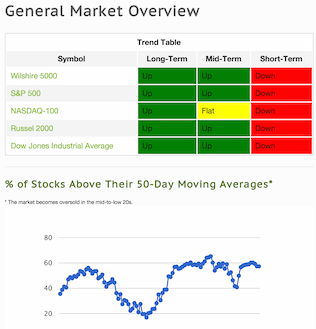 I created the General Market Overview page to help me get a quick read on the major indices. At the top of that page is a trend table, which shows how each index is faring with respect to its 10 (short-term), 50 (intermediate-term) and 200-day (long-term) moving averages. A quick glance at how much red or green is in that table gives me a good idea of the market's health and whether I should be looking for longs or shorts.
Under the the trend table is a graph of the percentage of stocks above their 50-day moving averages. I like to use that indicator during selloffs to tell me when the market's getting really oversold. (I don't like this indicator quite as much as Worden's T2108 but it's a decent proxy for T2108.) Once that indicator dips below 25 I take that as a sign the market's getting stretched too far to the downside and begin to take appropriate action depending on how I'm positioned at that time. Lower on that page are sections which summarize the most active stocks as well as the "hottest" signals for the day.
Finding New Trading Candidates
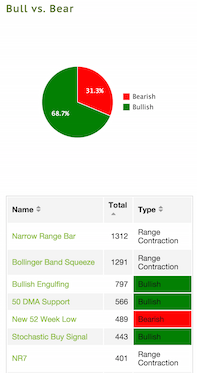
In order to hunt for new trade opportunities I'll check certain stock scan results. Depending on how the broad market is positioned and acting I'll focus more on bearish or bullish technical patterns. I usually find it useful to see what types of technical events occurred most on a given day, so I'll sort the scan results table by the 'total' column. Looking at those numbers gives me some insight into how the market is acting. I get a very different feeling if I see 900 stocks broke below their 50-day moving averages vs a day when we get 1,000 stochastic buy signals. Also note that there are two tabs on that page -- one tab which lists all the scans and one tab which breaks them out by category.
From there I'll drill down into the results of an individual scan. So let's say I've clicked on the "Down Five Days in a Row" scan. I'd do that if I was looking for stocks which I thought were due for a bounce. When I look at that scan I want to see the strongest stocks in that list, so I'll sort by grade and possibly even filter by stocks which are in an uptrend. All of the scan pages have filter controls which allow you to adjust the result list by the following:
- Trading Date
- Minimum Volume
- Minimum Price
- Trending - up / down / not trending
- Grade (basically a relative strength rating)
- Stocks / ETFs / Both stocks and ETFs

 From there I'll click through to any interesting stocks to see their detailed technical analysis page and stock charts. (I'll usually command-click on a Mac or CTRL-click on Windows to open the stock pages in new tabs on my browser.) If I like what I see on a stock's page I'll add it to my watchlist by clicking the add to watchlist button.
Managing / monitoring my watchlist
The watchlist and portfolio pages are what I check most on the site. The watchlist page lets me see for each stock its percentage change since being added to the list as well as the day's percentage change. I'll often sort the list by those columns to get a quick feel for how those stocks have been performing and to see which ones I need to trim.
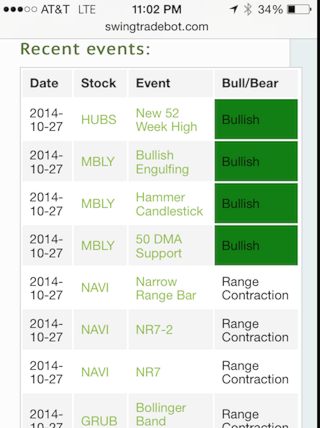 Below the list of stocks with their performance numbers is a list of recent technical signals for the stocks in the watchlist. I make sure to check this section daily to see any technical developments that inspire me to initiate a trade. As I wrote in an earlier blog post, this feature is the key reason I created the site. If I'm really pressed for time I can simply look at this section of the watchlist page to see if there are setups I need to take. One of my biggest problems in the past was missing setups and this feature has helped me tremendously in catching setups on stocks that I've been stalking. At the bottom of that page is recent news for stocks in the watchlist.
Managing Positions that I Currently Hold
The portfolio page is similar to the watchlist page but has some additional features. Similar to the watchlist page, it also shows performance numbers (in this case, in dollars as well as percentages), recent technical signals and recent news. Each night I make sure to check the recent signals section of this page. I'm especially interested in bearish events on my long positions and bullish events on my short positions. Those signals may not make me outright exit positions but they do put me on high alert to make sure my stops are where they need to be. Speaking of stops, the portfolio page also has a section to help you to manage trailing stops. When you add a stock to your portfolio you can enter a few different types of stops / exits:
- a stop at a specific price
- a Chandelier exit, which allows you to specify the number of ATRs
- a moving average stop -- you can choose from the 10, 20, 50 or 200-day moving averages
I check the stops section of that page in order to manage my stop loss orders in my brokerage account. Any stops that have been violated get highlighted in red. I plan to add some more functionality around stop management in the future.
Summary
So that's how I'm currently using the site. My watchlist and portfolio contain stocks that I either own or that I'm stalking. In either case, I want to be alerted to technical patterns / events that those stocks make. The site tracks the stocks for me and allows me to easily view the technical alerts. I use the nightly scan results to search for stocks making technical patterns that I like to trade. When I find a candidate I add it to my watchlist.
So how are you using the site? What features / functionality would you like to see added? You can leave a comment below or email me at swingtradebot - at - gmail - dot - com.
SwingTradeBot over 7 years ago
Thank you for sharing this website. I hope to learn a lot from you, with gratitude.
SwingTradeBot over 7 years ago
I just signed up to your annual subscription and most definitely appreciate all of the hard work you put in and look forward to your continued improvements, keep it up and I will continue to support!
SwingTradeBot over 7 years ago
I really appreciate the support VB!
SwingTradeBot over 7 years ago
You're welcome.
SwingTradeBot over 7 years ago
I'm glad to hear that! You're welcome.
SwingTradeBot about 7 years ago
Heya!
I've signed up to try the free version of your site, and I'm liking it. It seems to be giving me sound advice, and I could definitely see paying for a subscription. However, as a newbie to technical stock investing, I having trouble figuring out how to make this stuff work in practice.
1) I get the idea of a Chanedelier exit and a moving average stop, and I'd love to implement them. But as far as I can tell, while my broker (TD Amitrade, using the thinkorswim trading platform), DOES let me add these indicators to a stock chart, it DOESN'T let me actually have them issue a sell order when the trading line crossed the sell line.
AFAIK, the only built in form of automated, adjustable sell/buy commands are trailing stops, either percentage or price driven.
(That is, I'm sure there's some way to do this with scripts - but I don't know how to create, edit and implement scripts yet, so .... yeah ... )
2) For that matter, when I have ToS chart me a moving average stop using ATR lines, it is set up for someone who is going to transition between going long AND going short on a stock. Since I don't have day trading rights, this isn't really an option - and even if I could day trade (and I may upgrade over the next couple months), I'm still not sure I'll be trying shorts any time soon.
SwingTradeBot about 7 years ago
Hi Mike,
Unfortunately I don't know of a broker that implements Chandelier exits or moving average stops. One might exist & I haven't done any research on the topic but of 6 or so brokers I've ever used I don't recall any of them implementing such things.
However, I don't think it needs to be automated -- unless you're trading a ton of stocks at the same time. I simply adjust my stops manually once or twice a week. It's on my to-do list to have SwingTradeBot make it more obvious (send an alert?) when the stop loss levels change. That may be too noisy for the moving average stops but not so for the Chandelier Exits.
SwingTradeBot almost 7 years ago
Hi Daren,
I don't have a scan that does exactly what you described but you can get pretty close by combining a couple of my scans. So use the combo scan feature - https://swingtradebot.com/c... . And choose "Below Lower BB" and "Oversold Stochastic" as the two scans you want to combine. If you sort the resulting stocks by Grade, the ones with higher grades (Cs and Ds) are more likely to have just become oversold and to have broken the Bollinger Band on the day you're scanning for.
SwingTradeBot over 6 years ago
You're welcome.
SwingTradeBot over 6 years ago
Thanks dude! Really appreciate all your hard work!
SwingTradeBot over 2 years ago
Would like a scan set up fro the 200 ema above or below the 200 ema
WynTrader 11 months ago
TraderMike 11 months ago
Recent Comments
- TraderMike on IZM
- SuccessfulGerbil321 on IZM
- TraderMike on IZM
- TraderMike on Today's Outage
- Crunching_The_Market on Today's Outage
From the Blog
Popular Now
Featured Articles