ICZOOM Group Inc. is primarily engaged in sales of electronic component products to customers in Hong Kong and mainland China through its B2B e-commerce trading platform. These products are primarily used by China based small and medium-sized enterprises ("SMEs") in the consumer electronic industry, Internet of Things ("IoT"), automotive electronics and industry control segments. By utilizing latest technologies, the Company's platform collects, optimizes and presents product offering information from suppliers of all sizes, all transparent and available to its SME customers to compare and select. In addition to the sales of electronic component products, the Company also provides services to customers such as temporary warehousing, logistic and shipping, and customs clearance
Crazy! I am a new subscriber. I initiated short position in my small account around $50, around two before collapse. My account was down 4%, next day it collapsed. But premarket ramp up is unbelievable!! My account is up 30% overnight.
This is probably the craziest mover I've ever seen! I've been seeing this on the Parabolic Rise scan for a few days. I often say that getting involved in parabolic movers are like playing a game of musical chairs. The music came to a screeching halt (no pun because as I type this the stock is halted).
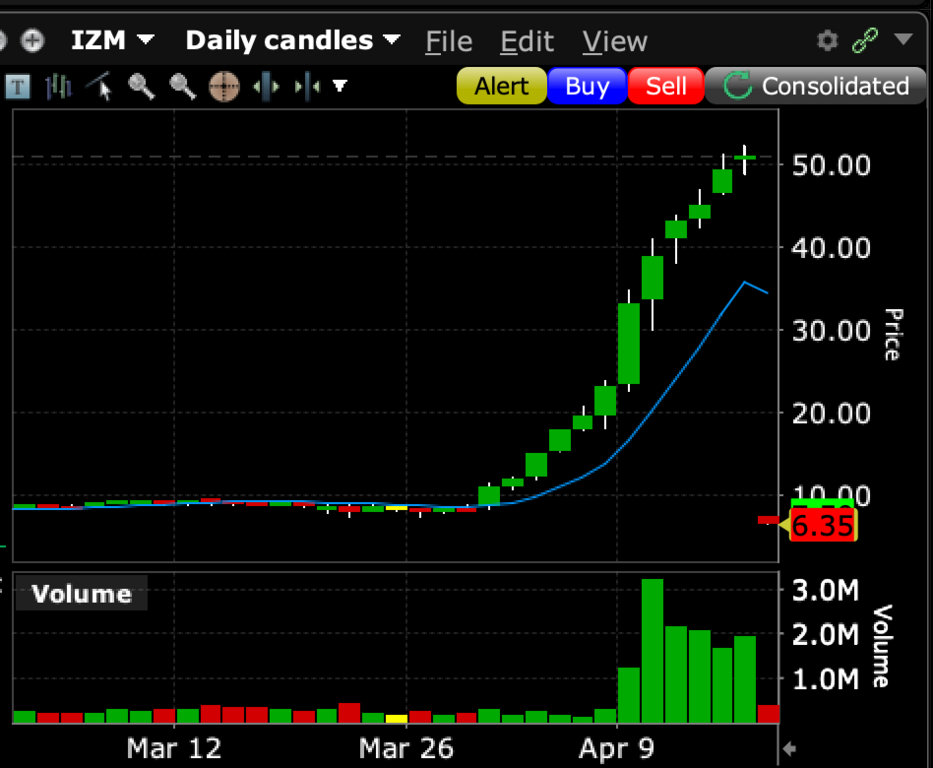
Here's the daily chart: Screenshot 2024-04-17 at 9.45.12 AM.png89.1 KBTalk about a rug pull -- a gap down from 50 to 6!
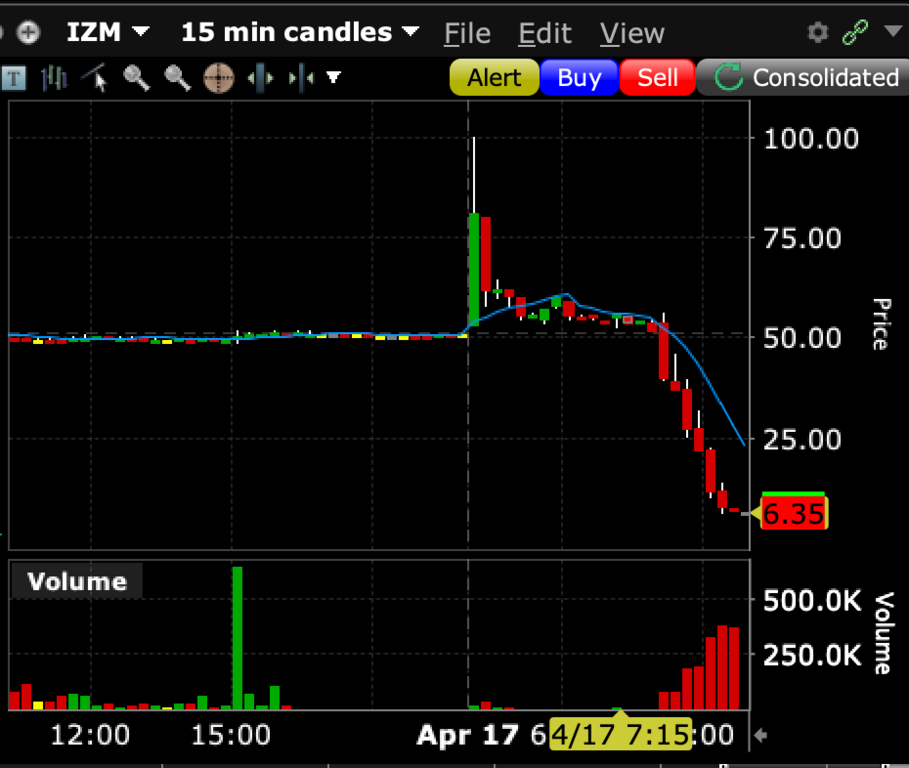
And here's how it's traded today on 15 minute candles. Note that this is showing pre-market trading & it doubled within 15 minutes around 4am. Madness! Screenshot 2024-04-17 at 9.45.39 AM.png91.9 KBThis is an extreme case of what happens when a short squeeze / buying mania ends.