Technical Analysis for BLRX - BioLineRx Ltd.
| Grade | Last Price | % Change | Price Change |
|---|---|---|---|
| D | 0.34 | -38.28% | -0.21 |
Earnings due: Nov 25
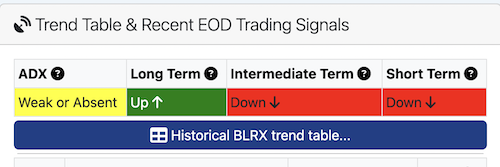
*** please verify all earnings dates ***| ADX | Long Term | Intermediate Term | Short Term |
|---|---|---|---|
| Strong | Down | Down | Down |
| Date | Alert Name | Type | % Chg |
|---|---|---|---|
| MACD Bullish Centerline Cross | Bullish | -38.28% | |
| Calm After Storm | Range Contraction | -38.28% | |
| Weak + Overbought | Other | -38.28% | |
| Wide Bands | Range Expansion | -38.28% | |
| Above Upper BB | Strength | -38.28% | |
| Overbought Stochastic | Strength | -38.28% | |
| Crossed Above 50 DMA | Bullish | -37.27% | |
| New Uptrend | Bullish | -37.27% | |
| Expansion Pivot Buy Setup | Bullish Swing Setup | -37.27% | |
| Pocket Pivot | Bullish Swing Setup | -37.27% |
| Alert | Time |
|---|---|
| 60 Minute Opening Range Breakdown | about 3 hours ago |
| Lower Bollinger Band Support | about 4 hours ago |
| 2x Volume Pace | about 4 hours ago |
| 1.5x Volume Pace | about 4 hours ago |
| 3x Volume Pace | about 4 hours ago |
Free Daily (Stock) Chart Reading
- Earnings date: 11/25/2024
BioLineRx Ltd. Description
BioLineRx Ltd., a clinical stage biopharmaceutical development company, engages in identifying, in-licensing, and developing therapeutic candidates. The company's development pipeline consists of six clinical-stage therapeutic candidates, including BL-1020, which is in Phase II/III clarity trial to enhance cognitive function in schizophrenia patients; BL-1040, a novel polymer solution that is under pivotal CE-Mark registration trial for use in the prevention of pathological cardiac remodeling following a myocardial infarction; and BL-5010, a medical device, which has completed Phase I/II clinical trials for the non-surgical removal of skin lesions. Its development pipeline also includes BL-1021 that is in Phase Ia clinical trial for the treatment of neuropathic pain, or pain that results from damage to nerve fibers; BL-7040, which is in Phase II clinical trial for the treatment of inflammatory bowel disease; and BL-8040, a peptide that has completed Phase I/II clinical trial for the treatment of acute myeloid leukemia and other hematological cancers. The company also has six products in various pre-clinical development stages for indications, such as central nervous system diseases, infectious diseases, cardiovascular, and autoimmune diseases. In addition, it operates a biotechnology incubator to evaluate therapeutic candidates. BioLineRx Ltd. has license agreements with Genoscience; Compugen Ltd.; RFS Pharma; Yissum and University of Genoa, Italy; Gestion Univalor, Limited Partnership; Jiangsu Chia-tai Tianqing Pharmaceutical Co., Ltd.; and Ikaria. The company was founded in 2003 and is headquartered in Jerusalem, Israel.
Classification
Sector: Healthcare
Industry: Biotechnology
Keywords: Biotechnology Pain Infectious Diseases Autoimmune Disease Clinical Development Drug Discovery Acute Myeloid Leukemia Pharmacology Clinical Research Clinical Trial Schizophrenia Inflammatory Bowel Disease Nerve Treatment Of Acute Myeloid Leukemia Neuropathic Pain Central Nervous System Disease Hematological Cancers Pivotal Compugen Biopharmaceutical Development Infarction Myocardial Infarction Polymer Solution Treatment Of Inflammatory Bowel Disease
| Indicator | Bull Case | Neutral / Hold | Bear Case |
|---|---|---|---|
| 50 DMA | |||
| 200 DMA | |||
| ADX Trend | |||
| Oversold / Overbought | |||
| Relative Strength |
TraderMike over 1 year ago
There are other ways to determine trend but moving averages are a pretty good & simple way to get a quick read.
SociableGnat503 about 1 year ago
TraderMike about 1 year ago
- Looks like a classic "buy the rumor, sell the news(fact)" situation.
- There's tons of overhead supply. So it could just be sellers who've been sitting on losses for who knows how long using the recent pop as an opportunity to get out.
- We're in a "risk off" market right now. The more speculative the stock, the more likely it is to be dumped.
View full discussion...
| Indicator | Value |
|---|---|
| 52 Week High | 1.89 |
| 52 Week Low | 0.39 |
| Average Volume | 364,789 |
| 200-Day Moving Average | 0.73 |
| 50-Day Moving Average | 0.50 |
| 20-Day Moving Average | 0.45 |
| 10-Day Moving Average | 0.47 |
| Average True Range | 0.04 |
| RSI (14) | 66.10 |
| ADX | 28.2 |
| +DI | 23.40 |
| -DI | 12.18 |
| Chandelier Exit (Long, 3 ATRs) | 0.44 |
| Chandelier Exit (Short, 3 ATRs) | 0.51 |
| Upper Bollinger Bands | 0.52 |
| Lower Bollinger Band | 0.38 |
| Percent B (%b) | 1.17 |
| BandWidth | 32.17 |
| MACD Line | 0.00 |
| MACD Signal Line | -0.01 |
| MACD Histogram | 0.0163 |
| Pivot Point Level | Traditional / Classic | Fibonacci | Demark | Woodie | Camarilla |
|---|---|---|---|---|---|
| Resistance 4 (R4) | 0.61 | ||||
| Resistance 3 (R3) | 0.61 | 0.59 | 0.60 | ||
| Resistance 2 (R2) | 0.59 | 0.57 | 0.59 | 0.60 | |
| Resistance 1 (R1) | 0.57 | 0.56 | 0.58 | 0.57 | 0.59 |
| Pivot Point | 0.54 | 0.54 | 0.55 | 0.54 | 0.54 |
| Support 1 (S1) | 0.52 | 0.53 | 0.53 | 0.52 | 0.50 |
| Support 2 (S2) | 0.50 | 0.52 | 0.50 | 0.49 | |
| Support 3 (S3) | 0.48 | 0.50 | 0.49 | ||
| Support 4 (S4) | 0.48 |