Technical Analysis for IHS - IHS Holding Limited
| Grade | Last Price | % Change | Price Change |
|---|---|---|---|
| C | 3.95 | 1.54% | 0.06 |
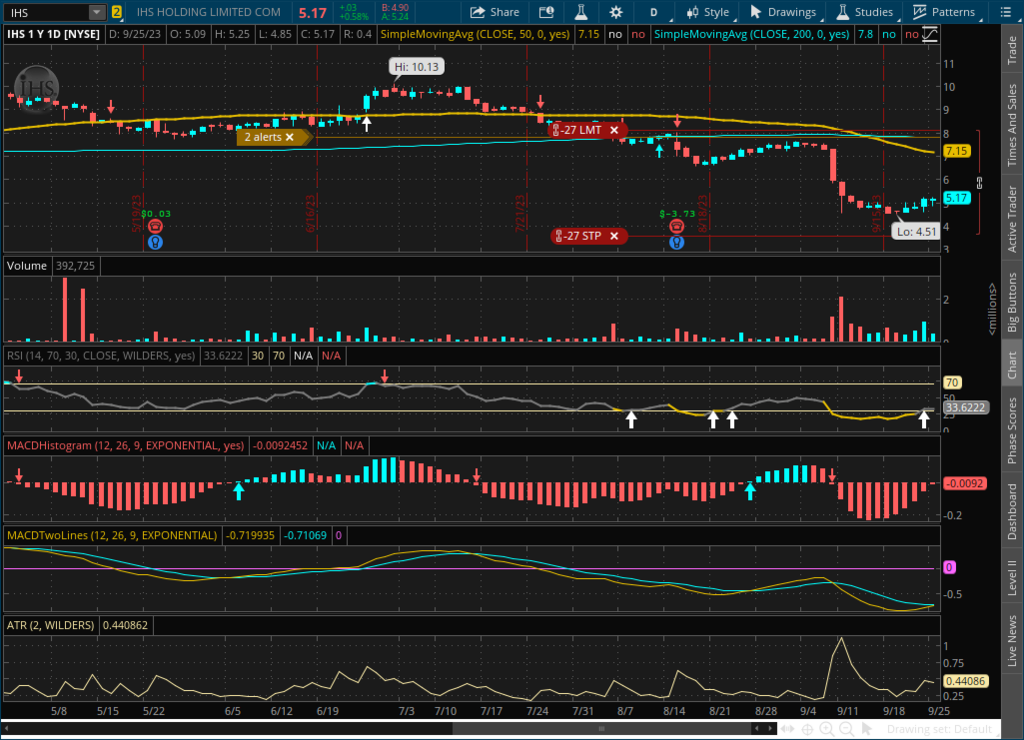
IHS closed up 1.54 percent on Thursday, May 9, 2024, on 45 percent of normal volume. Note that the stock is in overbought territory based on its Slow Stochastic indicator (14, 3, 3) -- so don't be surprised if it goes sideways or a pulls back.
Earnings due: May 21
*** please verify all earnings dates ***| ADX | Long Term | Intermediate Term | Short Term |
|---|---|---|---|
| Weak or Absent | Down | Up | Up |
| Date | Alert Name | Type | % Chg |
|---|---|---|---|
| Overbought Stochastic | Strength | 0.00% | |
| Jack-in-the-Box Bullish | Bullish Swing Setup | 1.54% | |
| Inside Day | Range Contraction | 1.54% | |
| Overbought Stochastic | Strength | 1.54% | |
| Expansion Breakout | Bullish Swing Setup | 0.00% | |
| Pocket Pivot | Bullish Swing Setup | 0.00% | |
| Upper Bollinger Band Walk | Strength | 0.00% | |
| Above Upper BB | Strength | 0.00% | |
| Overbought Stochastic | Strength | 0.00% | |
| Upper Bollinger Band Touch | Strength | 0.00% |
| Alert | Time |
|---|---|
| Possible NR7 | about 10 hours ago |
| Up 2% | about 14 hours ago |
| Jack-in-the-Box Bullish Entry | about 15 hours ago |
| Rose Above Previous Day's High | about 15 hours ago |
| Up 1% | about 15 hours ago |
Get a Trading Sidekick!
Let us help you stay on top of your investments. We will alert you to important technical developments on your
portfolio & watchlist.
Configure default chart indicators
Basic chart:
- Earnings date: 05/21/2024
IHS Holding Limited owns, operates, and develops shared telecommunications infrastructure in Africa, Latin America, Europe, and the Middle East. It offers colocation and lease agreement, build-to-suit, inbuilding, small cell infrastructure, fiber connectivity, and rural telephony solutions. The company serves mobile network operators, Internet service providers, broadcasters, security functions, and private corporations. IHS Holding Limited was founded in 2001 and is based in London, the United Kingdom.
Sector: Communication Services
Industry: Telecom Services
Keywords: Computing Telecommunications Information And Communications Technology Telephony Internet Service Provider Web Hosting Colocation Mobile Network Operators Colocation Centre Internet Architecture
Classification
Sector: Communication Services
Industry: Telecom Services
Keywords: Computing Telecommunications Information And Communications Technology Telephony Internet Service Provider Web Hosting Colocation Mobile Network Operators Colocation Centre Internet Architecture
| Indicator | Bull Case | Neutral / Hold | Bear Case |
|---|---|---|---|
| 50 DMA | |||
| 200 DMA | |||
| ADX Trend | |||
| Oversold / Overbought | |||
| Relative Strength |
| Indicator | Value |
|---|---|
| 52 Week High | 10.105 |
| 52 Week Low | 2.18 |
| Average Volume | 477,358 |
| 200-Day Moving Average | 4.70 |
| 50-Day Moving Average | 3.32 |
| 20-Day Moving Average | 3.53 |
| 10-Day Moving Average | 3.75 |
| Average True Range | 0.18 |
| RSI (14) | 67.32 |
| ADX | 23.19 |
| +DI | 32.59 |
| -DI | 15.35 |
| Chandelier Exit (Long, 3 ATRs) | 3.54 |
| Chandelier Exit (Short, 3 ATRs) | 3.58 |
| Upper Bollinger Bands | 4.04 |
| Lower Bollinger Band | 3.02 |
| Percent B (%b) | 0.91 |
| BandWidth | 29.08 |
| MACD Line | 0.15 |
| MACD Signal Line | 0.11 |
| MACD Histogram | 0.0425 |
| Pivot Point Level | Traditional / Classic | Fibonacci | Demark | Woodie | Camarilla |
|---|---|---|---|---|---|
| Resistance 4 (R4) | 4.14 | ||||
| Resistance 3 (R3) | 4.13 | 4.06 | 4.11 | ||
| Resistance 2 (R2) | 4.06 | 4.01 | 4.06 | 4.10 | |
| Resistance 1 (R1) | 4.00 | 3.98 | 4.03 | 4.01 | 4.09 |
| Pivot Point | 3.93 | 3.93 | 3.95 | 3.94 | 3.93 |
| Support 1 (S1) | 3.88 | 3.88 | 3.91 | 3.89 | 3.81 |
| Support 2 (S2) | 3.81 | 3.85 | 3.81 | 3.80 | |
| Support 3 (S3) | 3.75 | 3.81 | 3.79 | ||
| Support 4 (S4) | 3.76 |